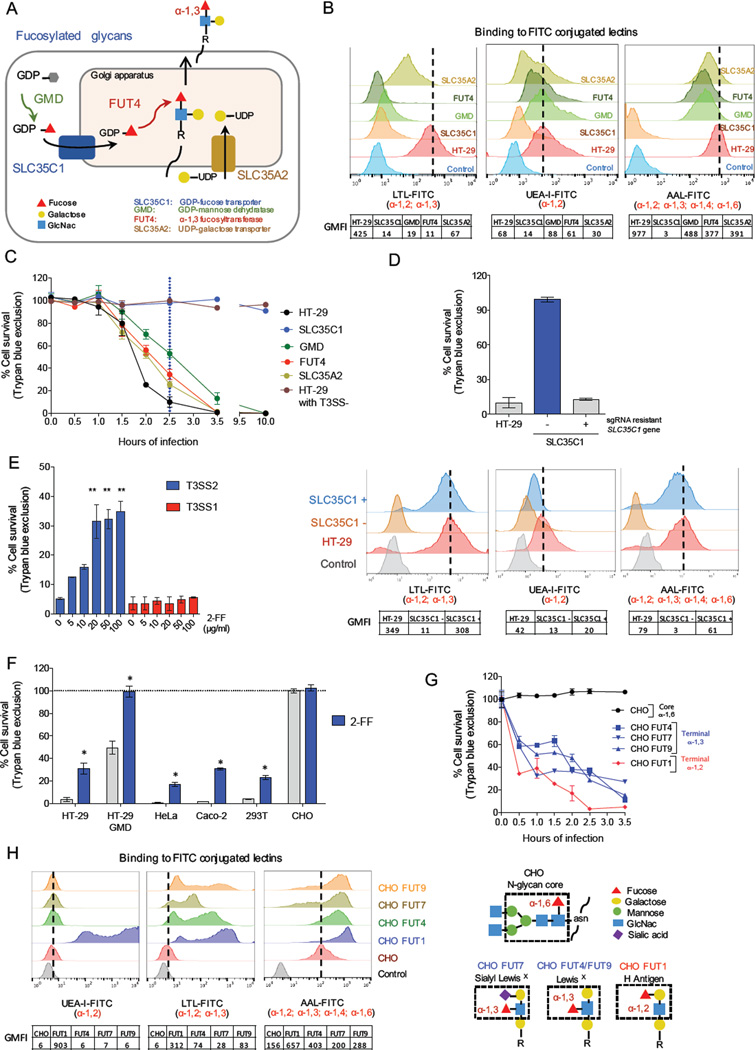
Figure 5. Terminal fucosylation is required for T3SS2 cytotoxicity.
(A) Overview of the steps in the synthesis of fucosylated glycans, highlighting mutations conferring resistance to T3SS2 killing. (B) Flow cytometry profiles of HT-29 and mutant cells bound to fucose-specific FITC-conjugated lectins that recognize distinct fucosylation linkages. Charts below the graphs show geometric mean fluorescence intensity (GMFI). AAL, Aleuria aurantia; LTL, Lotus tetragonolobus; UEA-1, Ulex europaeus Iectin. (C) Kinetics of survival of HT-29 and mutant cells after infection with T3SS2+ or T3SS2− V. parahaemolyticus. (D). T3SS2 killing (top) and fucosylation (bottom) of wt, SLC35C1 mutant cells, and SLC35C1 mutant cells expressing an sgRNA resistant SLC35C1 cDNA. (E) Impact of the fucosylation inhibitor 2-FF on T3SS1 and T3SS2 killing of HT-29 cells. (F) Impact of 2-FF on survival of different cell lines infected with T3SS2+ V. parahaemolyticus. (G) Kinetics of cell survival following T3SS2+ V. parahaemolyticus infection of CHO parental and mutant cells. (H) Lectin binding profiles for CHO cells transduced with FUT genes that generate diverse terminal fucose linkages. Structures of the CHO cell N-glycan core and various terminal fucosylated blood group antigens are shown on the right. Data are mean with SEM (n=3), P values (* < =0.01, ** < 0.001) are based on one-way ANOVA with Dunnet post test correction.

