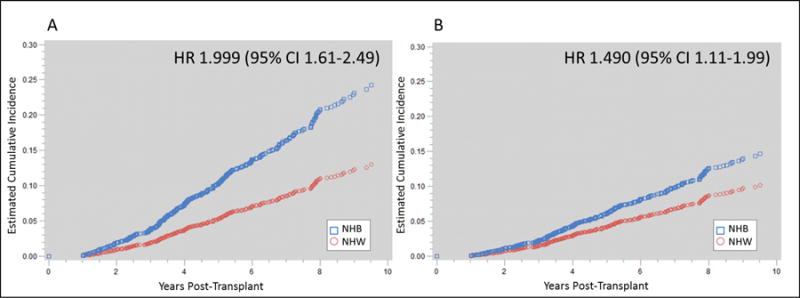
Figure 2.

Cumulative incidence function curve estimates for the primary outcome of graft loss in NHB vs. NHW kidney transplants for the unadjusted model (Figure 2A) and the fully adjusted model (Figure 2B) demonstrating a 24% relative reduction in risk for NHBs when controlling for all measured variables
