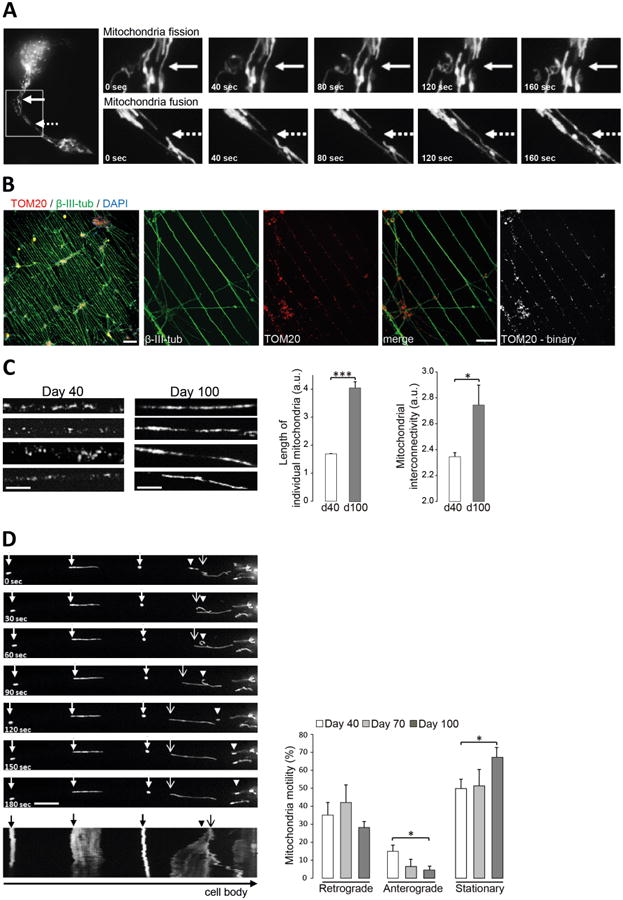
Figure 3. Analysis of mitochondrial dynamics in long-term neuronal cultures.

(a) Image series showing mitochondrial trafficking as fusion (solid arrow; upper panel) and fission (dashed arrow, lower panel) events in one neuronal process over 160 seconds. iPSC-derived neurons were plated onto a live cell imaging substrate representing a flower-shaped micropattern. Mitochondria were visualized by transduction of mito-GFP BacMam 2.0. (b) Immunofluorescence images of iPSC-derived neurons grown on a substrate with line-shaped pattern shown in low magnification (10×; Scale bar, 100μm) or higher magnification (40×; Scale bar, 20μm). Cells were labeled with neuronal marker β-III-tubulin (green), mitochondrial marker TOM20 (red) and DAPI (blue). TOM20 signal was converted into a binary image for analysis of mitochondrial structures. (c) Mitochondrial length and interconnectivity in individual neuronal processes of iPSC-derived neurons grown on substrates with line-shaped pattern was analyzed after 40 (d40) and 100 days (d100) of differentiation using ImageJ software. *p<0.05; ***p<0.001. Scale bar, 5μm. (d) Image series showing retrograde moving (arrowhead), anterograde moving (arrow with open arrowhead) or stationary (arrow with closed arrowhead) mitochondria over 180 seconds. Corresponding kymograph is shown at the bottom of the image series. Scale bar, 10μm. Mitochondrial trafficking was followed after 40, 70 and 100 days of differentiation and retrograde moving, anterograde moving (≥ 10μm/3 minutes in either direction) and stationary mitochondria were analyzed using ImageJ software. The percentage motility of mitochondria along the neuronal process was calculated as a percentage of the total number of mitochondria imaged per process. *p<0.05.
