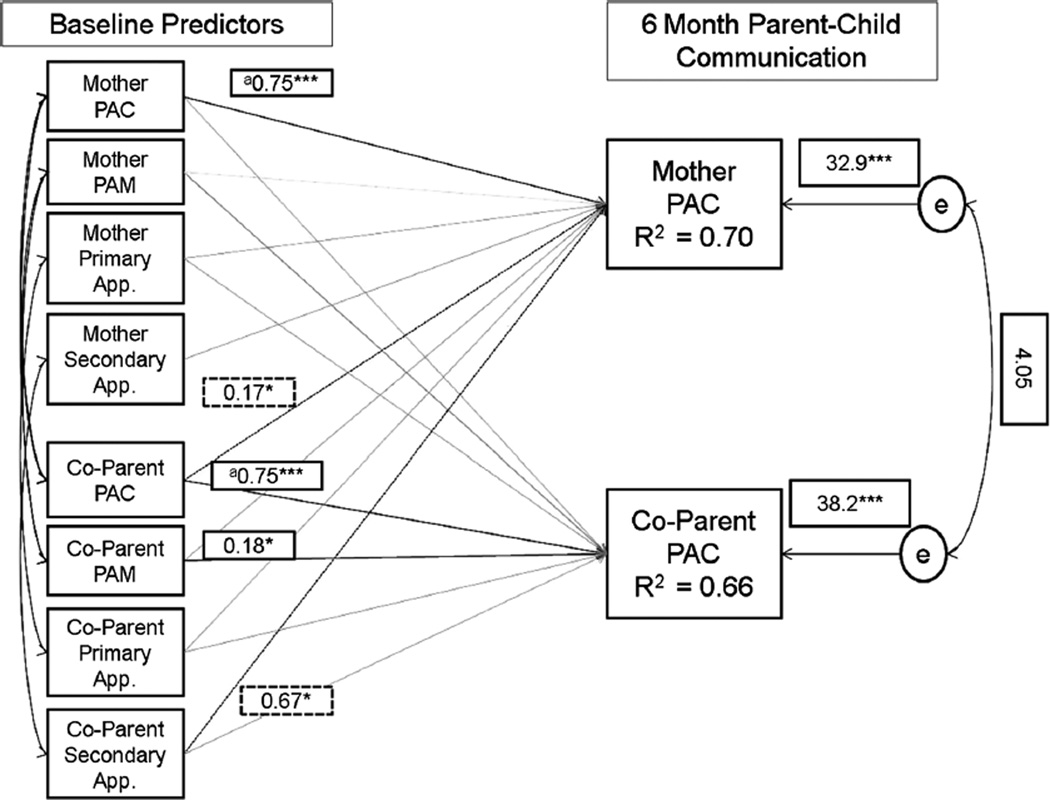
Fig. 1.
Final actor partner interdependence model of mothers’ and co-parents’ parent–child communication. Note Model χ2 [18] = 19.37, p = 0.37. Comparative Fit Index = 0.993. Root mean square error approximation = 0.027 (90 % CI 0.0, 0.09). Raw (unstandardized) parameter estimates are displayed. Shaded lines represent non-statistically significant parameters (estimates are not displayed). Solid lines are actor effects, dashed lines are partner effects. aCoefficient paths constrained to be equal based on Wald χ2 test. Covariates included in the model were maternal proband status and child gender. For p values: * <0.05; ** <0.01; *** <0.001

