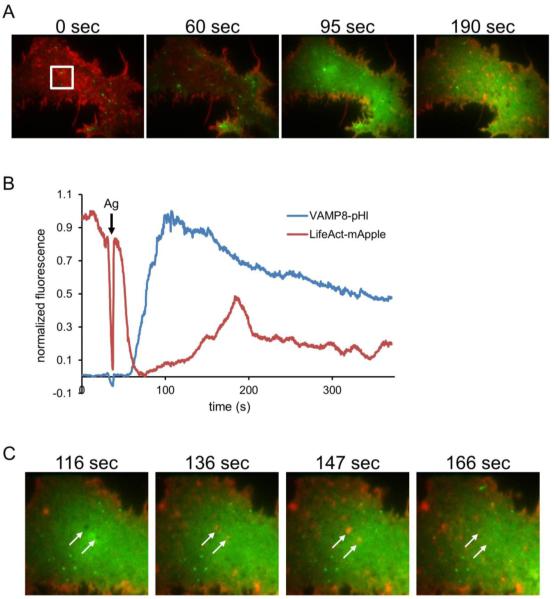
Figure 6. Ag-stimulated exocytosis of VAMP8-pHl is temporally correlated with cortical actin dynamics.
RBL-2H3 cells co-transfected with VAMP8-pHl (green) and LifeAct-mApple (red) were visualized by two-color TIRF microscopy and stimulated with 200 ng/ml Ag. A representative cell is shown. (A) Individual frames show a cell before Ag addition (0 sec) and at indicated times after Ag addition (Ag added at 35 sec). (B) Quantification of the fluorescence intensity in white box shown in (A), normalized by scaling between 0 and 1. (C) Individual frames from the same cell in (A) show LifeAct (F-actin) and Vamp8-pHl dynamics after Ag addition, and arrows point to apparent plasma membrane invaginations. Image boxes are 32 × 25 μm in (A) and 16 μm2 in (C). Scale bar is 8 μm in (A) and 4 μm in (C).

