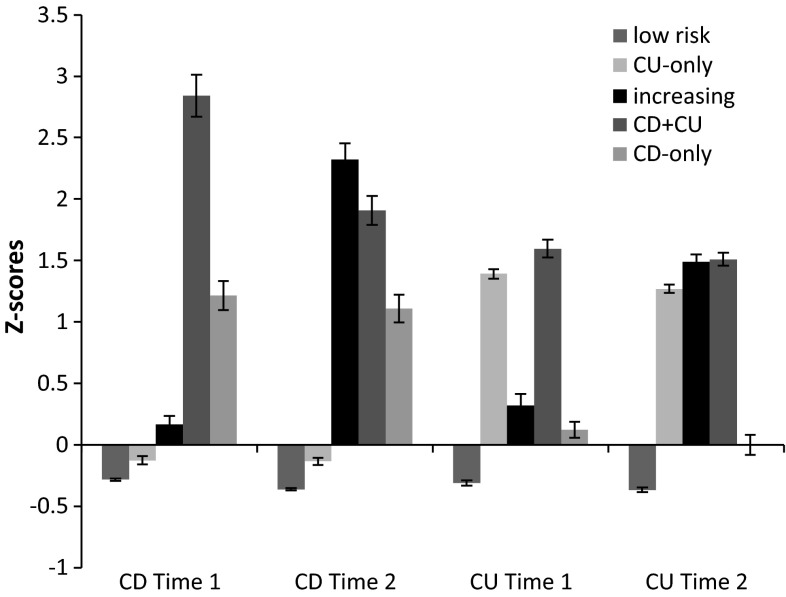
Fig. 1.
Callous–unemotional traits (CU) and conduct disorder symptoms (CD) scores (z-scored) at Time 1 and Time 2 for the 5 groups: “low” (low on conduct disorder symptoms and callous–unemotional traits), “CU-only” (high on callous–unemotional traits, low on conduct disorder symptoms), “increasing” (low on both at Time 1, high on both at Time 2), “CD + CU” (high on both conduct disorder symptoms and callous–unemotional traits) and “CD-only” (high on conduct disorder symptoms, low on callous–unemotional traits): means and standard errors of the mean

