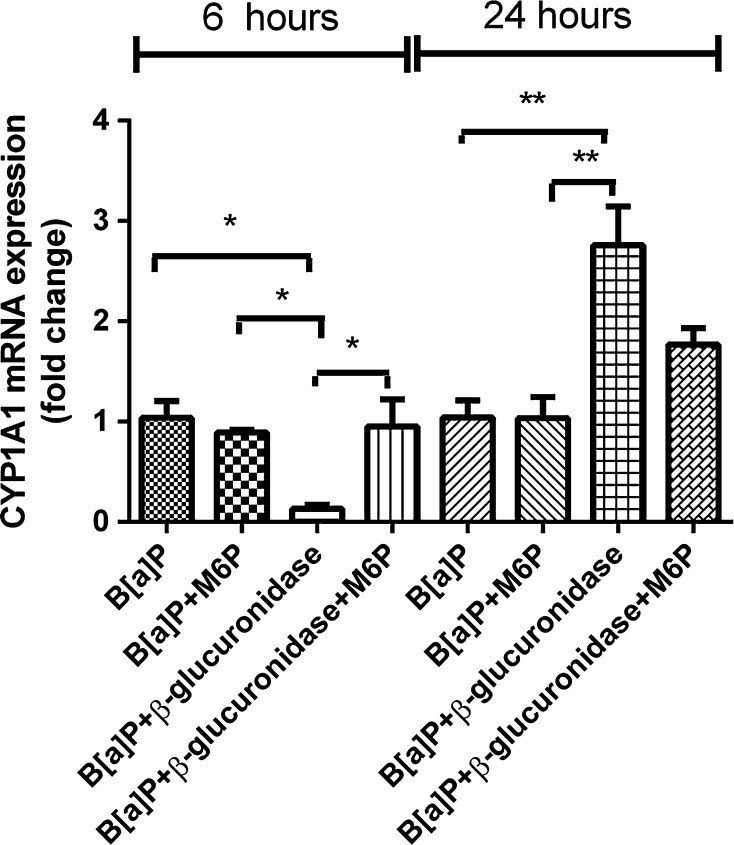
Fig. 9.
RT-qPCR analysis of gene expression CYP1A1 in A549 cells after exposure to β-glucuronidase and B[a]P with the IGF2R inhibitor M6P. Cells were exposed to 1 μM B[a]P with or without 4 U/ml β-glucuronidase and with or without 100 μM M6P. Cells were harvested after the times indicated. Cells exposed to B[a]P and sodium acetate buffer were used as vehicle control. All values are given as the mean ± SEM (n = 4 per data point) (*p < 0.05; **p < 0.01; ***p < 0.001)

