Fig. 2.
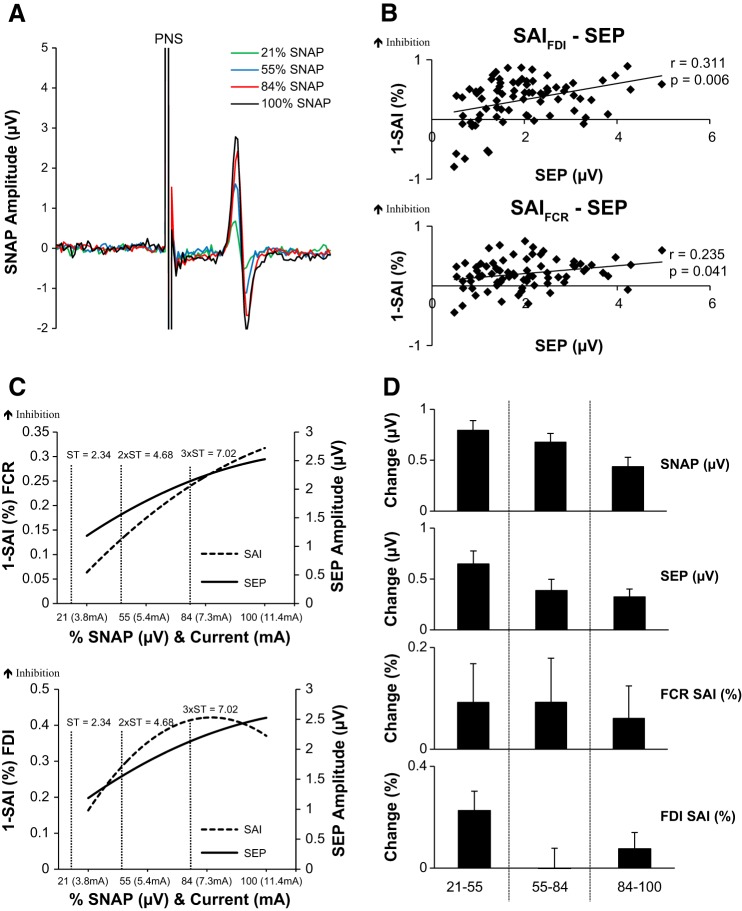
Digital nerve stimulation. A: average SNAPs recorded from 1 individual at each intensity of digital nerve stimulation. B, top: correlations between SAI evoked in FDI and SEP 1 reveal a significant positive correlation showing that as SEPs increase the depth of SAI increases. Bottom: correlations between SAI evoked in FCR and SEP 1 reveal a significant positive correlation showing that as SEPs increase the depth of SAI increases. C, top: second-order polynomial trend lines of the recruitment curves for each measurement in FCR are plotted to represent how each measure responds to the increases in SNAP. For comparison, group-averaged sensory thresholds (ST, 2× ST, and 3× ST) are shown, all of which are below SNAPmax. Bottom: second-order polynomial trend lines for SAI in FDI and SEPs. D: the group-averaged % change (±SE) in each increment of stimulation intensity for the SNAP, SEP, and SAI. As shown, SNAP, SEP, and SAIFCR and SAIFDI increase, as depicted by the positive % change, to the highest intensity increment.

