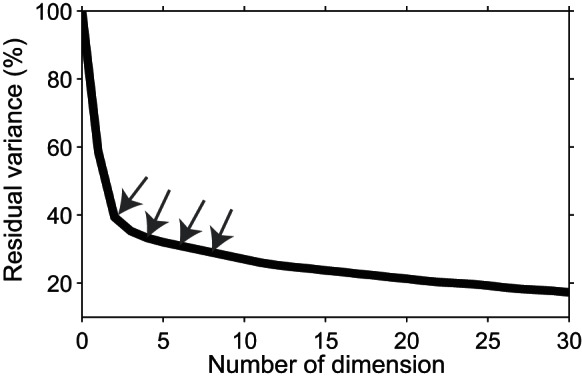
Fig. 3.

The percentage of unexplained variance. The percentage of unexplained (residual) variance against the number of PCA dimensions used for construction of the movie. The first 2 dimensions of the PCA analysis reported here were used to make the movie. The neural population responses to all stimuli in the 65- to 170-ms time window were used to extract the principle dimensions by PCA. The gray arrows indicate the values for second, fourth, sixth, and eighth dimensions. The explained (100 − unexplained) variance quantifies how well information is represented in the reduced, low-dimensional neural space.
