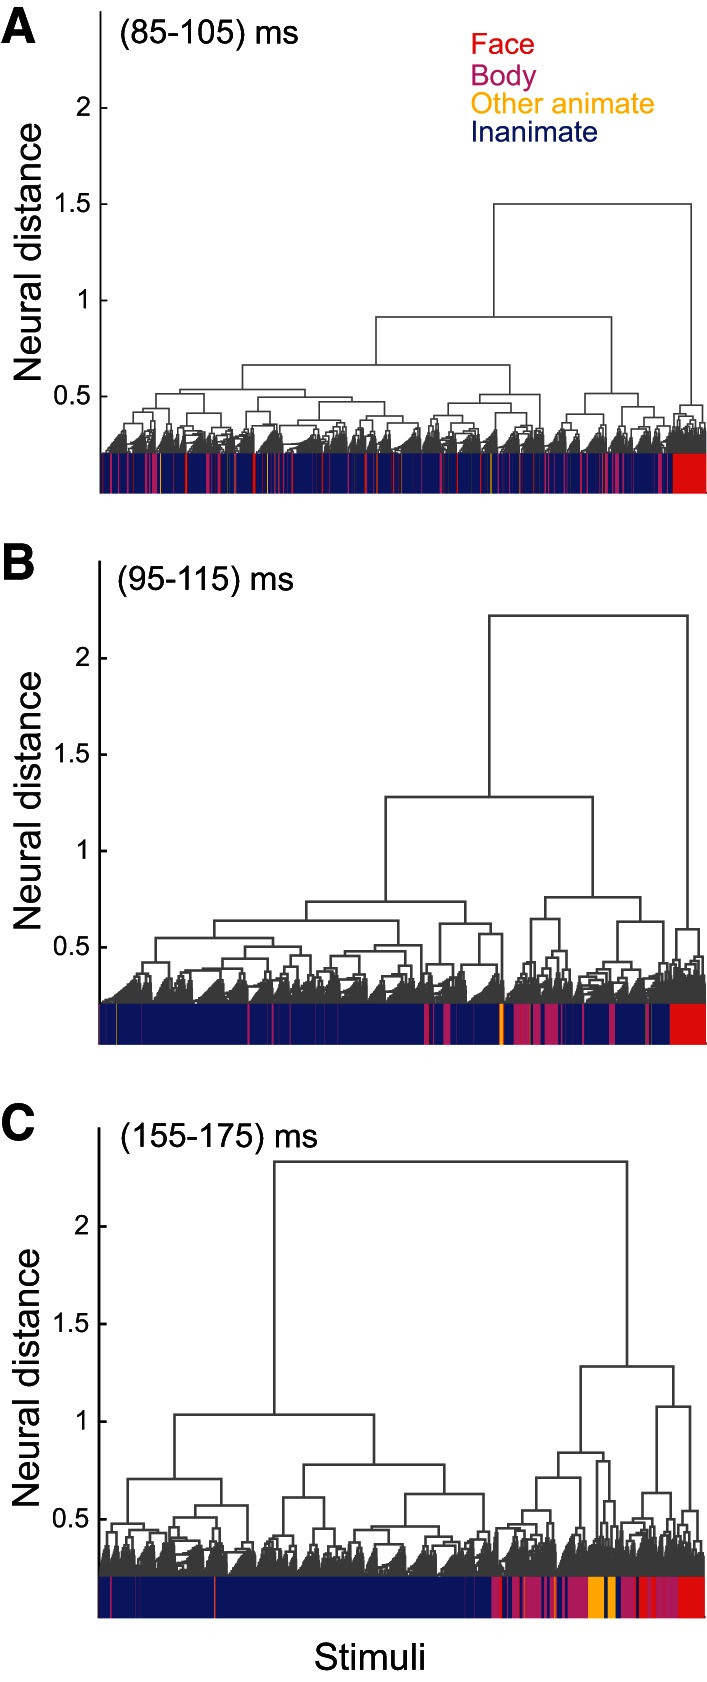
Fig. 6.

Hierarchical clustering of IT response patterns at early and late phase of response. Hierarchical cluster trees were computed at early (A and B; 85–105 and 95–115 ms, respectively) and late (C; 155–175 ms) phases of response. At the lowest level of the tree (horizontal axes), face, body, other animate, and inanimate exemplars are indicated by red, purple, yellow, and blue lines, respectively. All animates, excluding face and body categories, make “other animate” stimuli. The vertical axes indicates average neural distance between the stimuli of subclusters.
