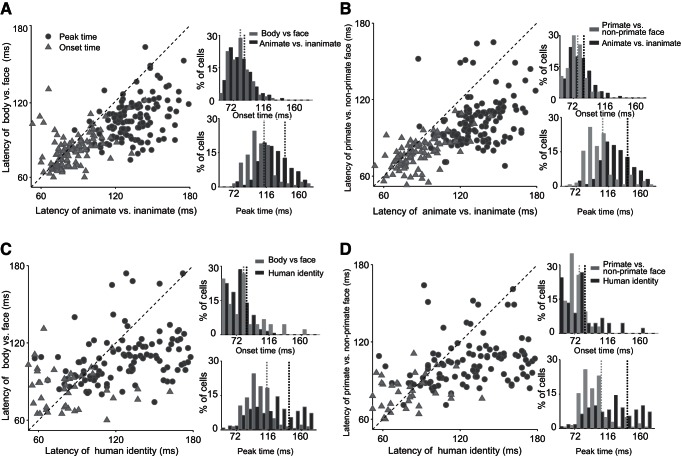
Fig. 7.
Onset and peak-latency scatter plots of single cells. Each panel (A–D) shows the scatter plot of onset (triangles) and peak (circles) latencies of 1 pair of categories against another pair (A: face vs. body against animate vs. inanimate, B: primate faces vs. nonprimate faces against animate vs. inanimate, C: face vs. body against human identity, and D: primate faces vs. nonprimate faces against human identity). Each point represents 1 cell. The distributions of latencies (top: onset; bottom: peak) for the corresponding categories are depicted on the right side of the scatter plots. The dashed, vertical lines in distribution plots show the mean latencies.

