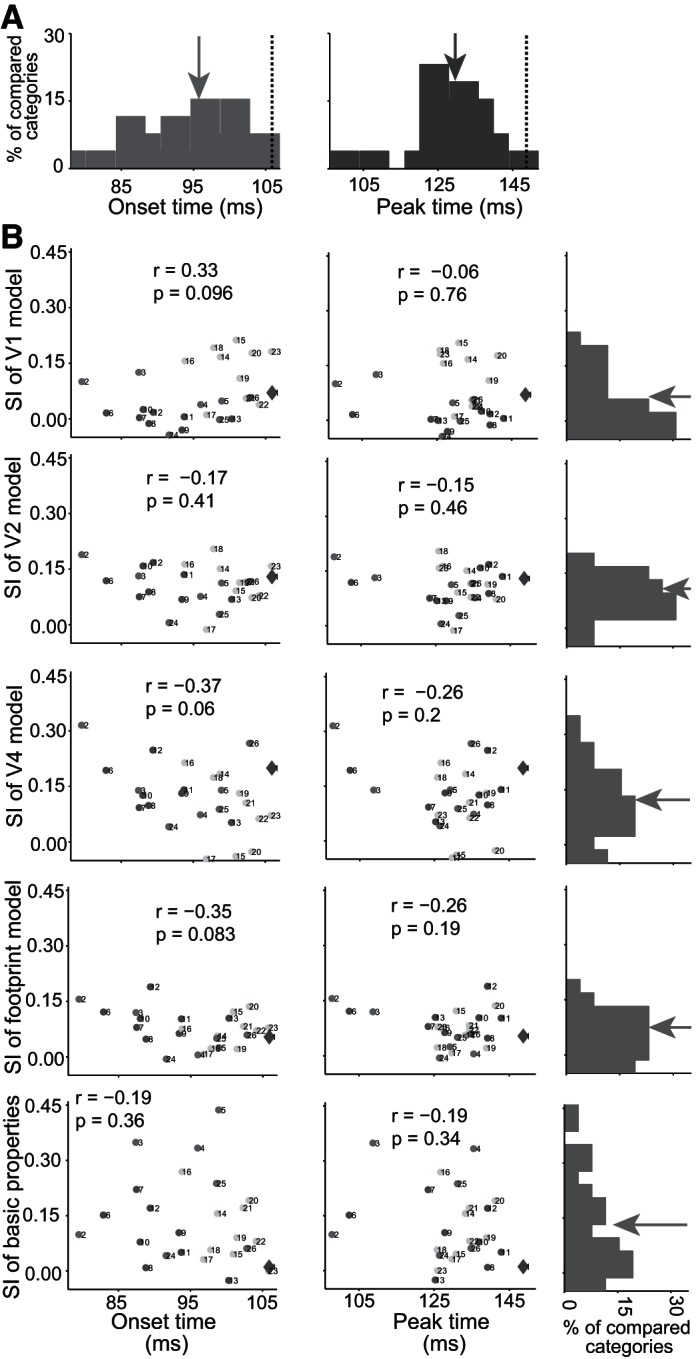
Fig. 9.

Distribution of latencies and relationship of physical similarity and latencies of category representation in IT cortex. A: the distribution of onset (left) and peak (right) latencies for 26 pairs of tested categories (25 mid-levels and 1 superordinate level). The dashed lines show the onset (left) and peak (right) latency of superordinate level, animate vs. inanimate, and the arrows show the mean value of latency distributions. B: in each panel, we calculated the within/between class physical distinction using SI and different physical models (V1, V2, V4, foot print, and basic properties). All of the SI values for physical distinction were bias corrected by random shuffling of category labels, 1,000 times in each tested mid-level contrast category. There was no significant correlation between latency of category representation and within/between physical similarity for any of the tested models (the correlation coefficient values with their P values are shown in each panel). The big diamond shows the animate vs. inanimate categorization; numbers next to each point indicate the following: 1, animate vs. inanimate; 2, human vs. animal; 3, monkey vs. animal; 4, hand vs. reptile; 5, hand vs. butterfly; 6, human face vs. animal face; 7, monkey face vs. animal face; 8, human face vs. bird face; 9, monkey face vs. bird face; 10, human face vs. cat face; 11, monkey face vs. cat face; 12, monkey face vs. human face; 13, rhesus face vs. nonrhesus face; 14, human body vs. animal body; 15, monkey body vs. animal body; 16, human body vs. 4-limb body; 17, monkey body vs. 4-limb body; 18, bird body vs. 4-limb body; 19, human body vs. bird body; 20, monkey body vs. bird body; 21, human body vs. cat body; 22, human body vs. dog body; 23, bird body vs. cat body; 24, artificial inanimate vs. natural inanimate; 25, car vs. furniture; 26, car vs. common tools. The arrows show the mean value of latency distributions.
