
Figure 7.
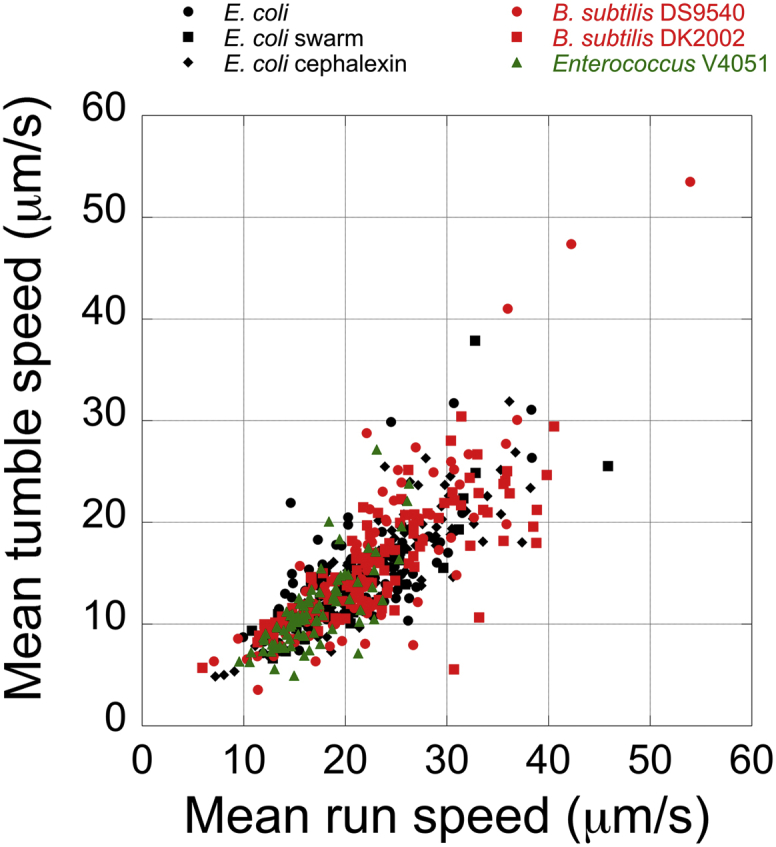
Correlation between mean tumble speeds and mean run speeds for cells of different types. Black dot, untreated E. coli; black squares, E. coli swarm cells; black diamonds, cephalexin-treated E. coli; red dots, B. subtilis DS9540 wild-type; red squares, B. subtilis DK2002; green squares, Enterococcus V4051.