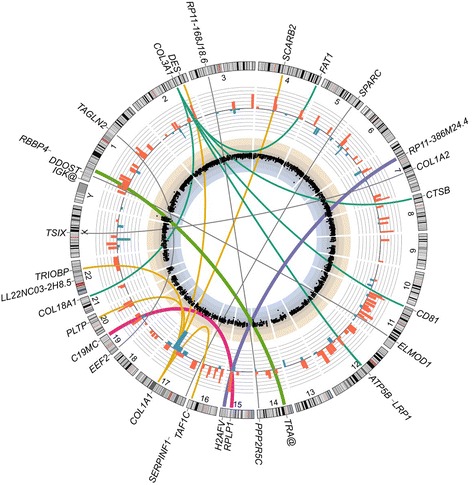
Fig. 2.

Genomic status of MNTI primary tumor. Circos plot of genomics data. Innermost track: Scatterplot of log2 (signal intensity ratios) for SNP array probes. Genomic DNA from the patient’s tumor and blood (reference signal) were hybridized to a custom 4 x 180 k SNP array containing probes for the whole-genome with a greater density for 1500 cancer-associated genes. There were no apparent copy number variations and the tumor was euploid. Blue and beige shaded sections represent ranges over which genomic losses or gains, respectively, would be expected to occur. Bar graph track: 185 genes are significantly (adjusted P-value ≤ 0.05) up-regulated (red) or down-regulated (blue) in the MNTI relative to their expression in an RNA-Seq dataset (GEO accession: GSE28875) for in vitro-differentiated human neural crest cells (hNCC). Bars represent log2 (FPKM + 0.01) fold-changes. Links: thin gray links are shown between partner genes for fusions where the reciprocal has not been detected, except for COL3A1 and COL1A1, where rearrangements with multiple partner genes are predicted by the FusionCatcher analysis. Thicker links are shown for fusion genes where the reciprocal has been detected: RPLP1-C19MC (magenta), H2AFV-RP11-386 M24.4 (purple) and RBBP4-TRA@ (green)
