Fig. 2.

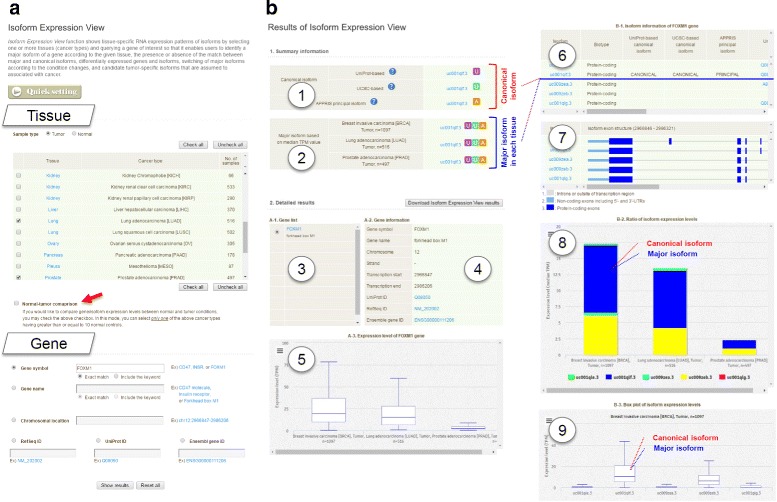
An example of using the Isoform Expression View function. a Start page, in which users can select one or more tissues and provide a gene to be searched. b Result page is consisted of i) summary information and ii) detailed results. Summary information shows canonical and principal isoforms of the gene (no. 1) and major isoforms for the selected tissues (cancer types; no. 2), in which two “U” squares in purple and green background mean that corresponding major isoforms are matched to UniProt-based and UCSC canonical isoforms, respectively, and a “A” square in orange background represent that the major isoform is identical with APPRIS principal isoform. Detailed results include gene list (no. 3), gene information (no. 4), gene expression level represented by box plot (no. 5), isoform information (no. 6), exon structure of each isoform (no. 7), ratio of isoform expression levels represented by stacked column chart (no. 8), and isoform expression levels represented by box plot (no. 9)
