Fig. 5.

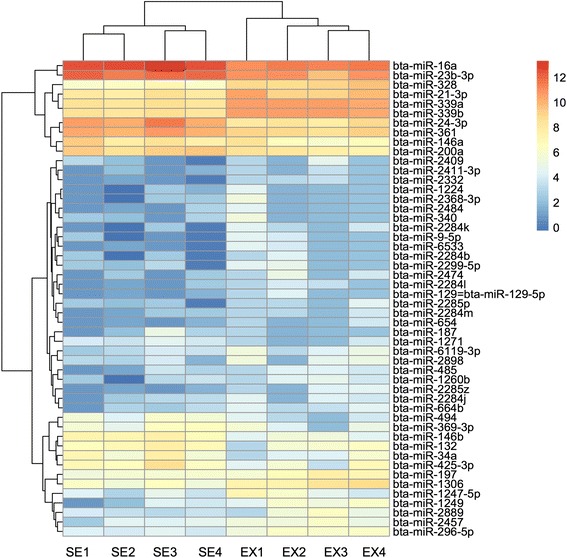
Heatmap generated by clustering of the 50 most variable miRNAs in sera (SE) and exosomes (EX) from four cattle. Colors represent different normalized sequencing reads number as indicated by the color bar (Log2RPM)

Heatmap generated by clustering of the 50 most variable miRNAs in sera (SE) and exosomes (EX) from four cattle. Colors represent different normalized sequencing reads number as indicated by the color bar (Log2RPM)