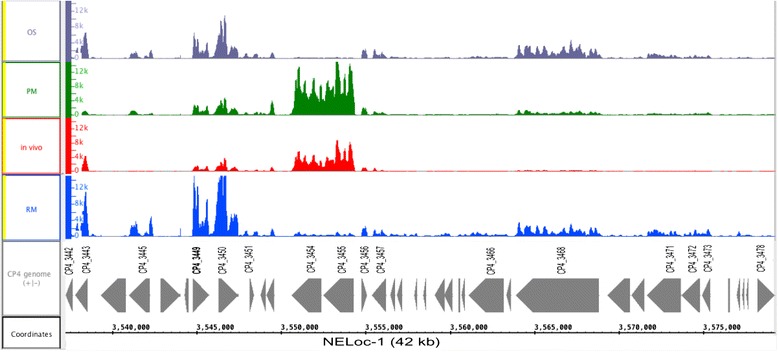
Fig. 5.

Visualization of Mapped Sequence Reads for the NELoc-1. The genetic organization of NELoc-1 is shown, each arrow representing a predicted gene. Predicted functional annotations and locus tags are shown above each gene, respectively. Mapped sequence reads for the NELoc1 genes were shown in the IGB browser. The figure shows the expression of CP4_3443 (β-lactamase protein), CP4_3449 (NetB), CP4_3450 (ricin-protein), CP4_3454 and CP4_3455 (chitinase A and chitinase B), CP4_3468 (F5/8 type C protein) expressed in different growth conditions: OS: Osmotic Shock, PM: Poor media, in vivo: from chicken intestinal loops, RM: rich media
