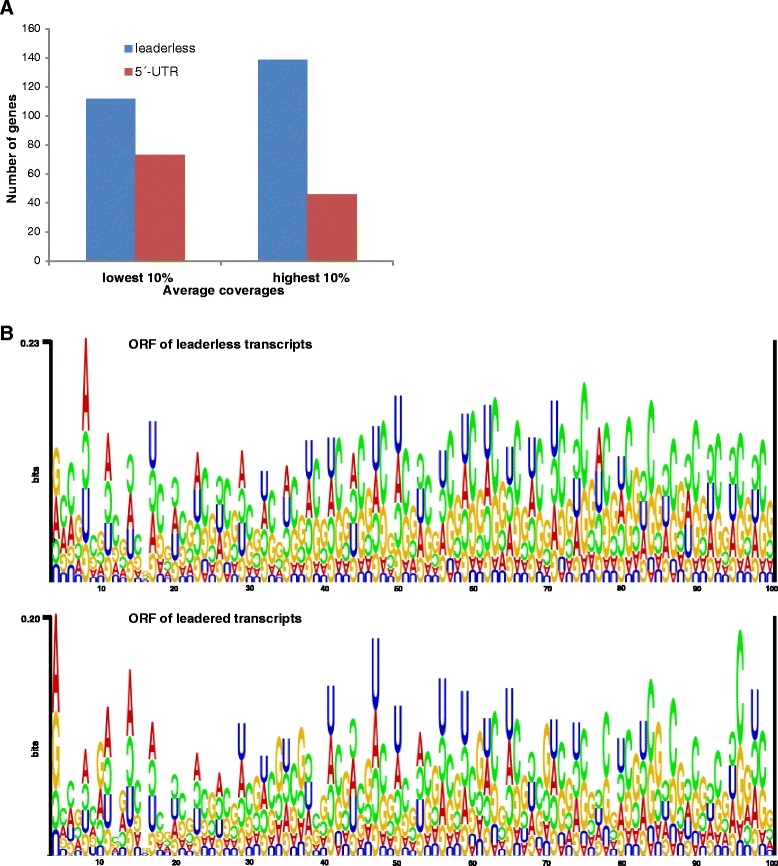
Fig. 3.

Comparison of leaderless and leadered transcripts. a Expression levels of leaderless and leadered transcripts. Number of leaderless (blue) and leadered (red) genes in the 10 % of transcripts with the lowest average coverage (left) and with the highest average coverage (right) are shown. b Sequence motifs in the ORFs of leaderless (top) and leadered (bottom) genes. Sequence motifs in the first 97 nt after the start codon in leaderless (top) and leadered (bottom) transcripts were calculated using “RNA Structure Logo” [47]. The fractions of A, C, G, and U in the two sequence groups were considered. Upright letters indicate nucleotide frequencies above the statistical expectation, bottom up letters indicate nucleotide frequencies below the statistical expectation. The size of the letters represents the deviation from the statistical expectation
