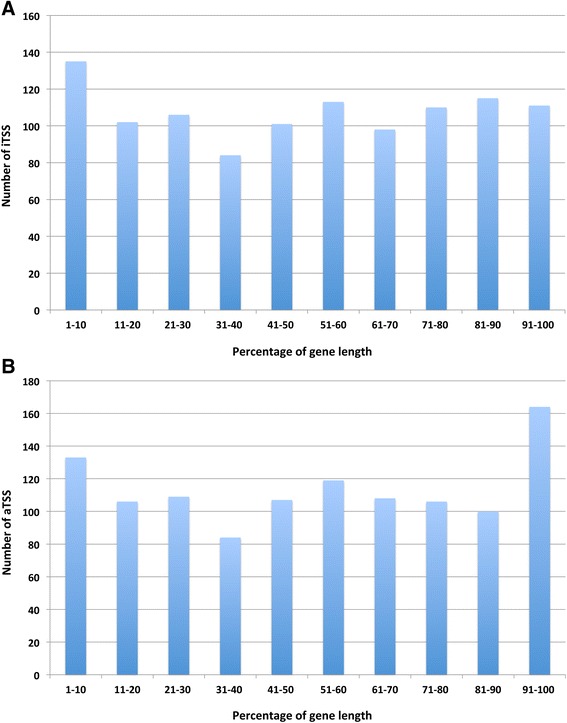
Fig. 7.

Intragenic distribution of iTSS and aTSS. a Location of iTSSs in annotated genes. Genes for which an iTSS in sense was detected were divided into 10 equal-sized sections (x-axis). The number of iTSS in each section was determined (y-axis). b Location of aTSSs in annotated genes. Genes for which an aTSS was detected were divided into 10 equal-sized sections (x-axis). The number of aTSSs in each section was determined (y-axis)
