Fig. 8.

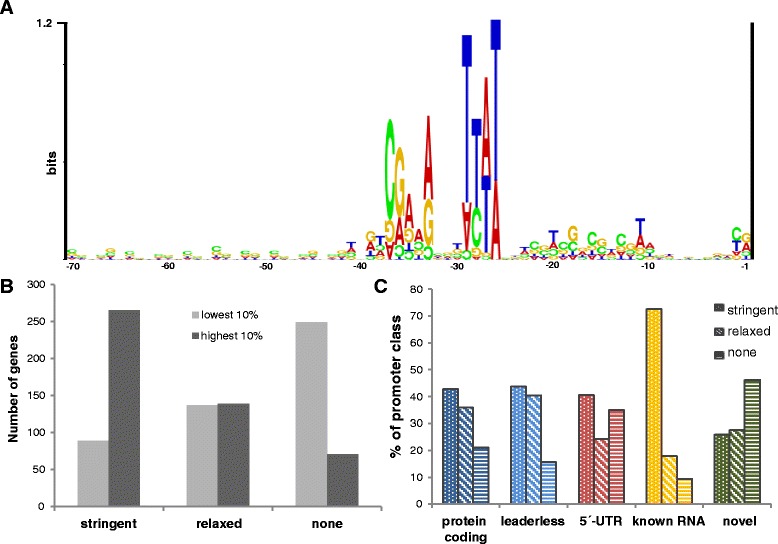
Promoter analysis. a Motifs of basal promoter elements. A position weight matrix (PWM) was generated and used to calculate a promoter score for each gene. An RNA structure logo was generated from the 28-mers that resulted in the final position weight matrix (PWM). This logo was generated from 1302 sequences with a MOODS search score below the threshold of 0.001. b Expression of genes preceded by a stringent, a relaxed, or no recognizable promoter. The numbers of genes preceded by a stringent, a relaxed, or no recognizable promotor that were present in the groups of transcripts with the 10 % highest (dark grey) and the 10 % lowest (light grey) average coverage. c Fractions of stringent and relaxed promoters preceding different classes of genes. Genes with a promoter score above 4.7 (p ≤ 0.001) had a stringent promoter, genes with a promoter score between 1.2 and 4.6 (p ≤ 0.01) had a relaxed promoter. The fractions of genes preceded by a stringent, relaxed, or no recognizable promoter were calculated for the indicated classes of genes
