
Fig. 2.
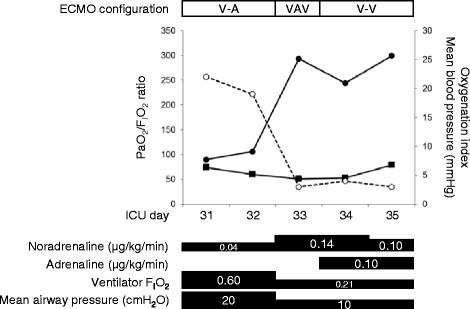
Clinical course of the patient. Graph showing the clinical course of the patient with an improvement in the PaO2/FIO2 ratio and oxygenation index after shifting from VA ECMO to VAV ECMO. Blood pressure was stable in shifting from VA ECMO to VAV ECMO. Closed circles indicate the PaO2/FIO2 ratio; open circles indicate the oxygenation index; and closed squares indicate blood pressure