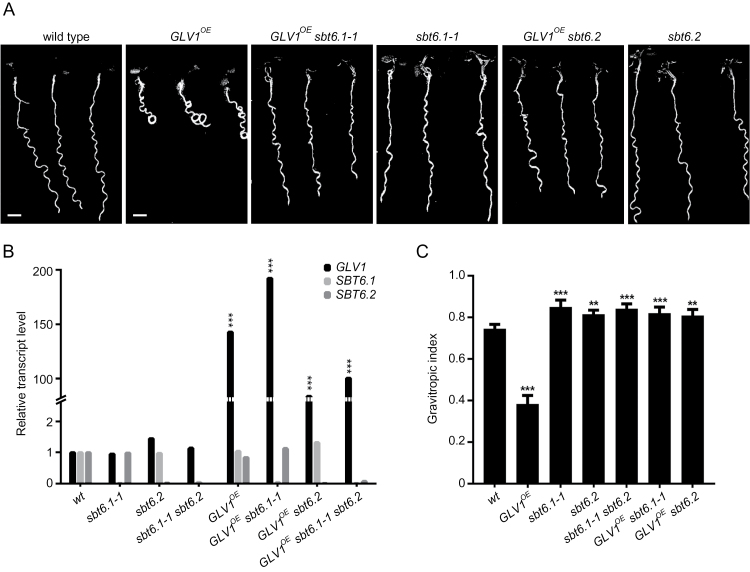
Fig. 1.
Suppression of the GLV1 OE curly root phenotype in subtilase mutants. (A) Seedlings grown on inclined agar plates for 7 days after germination (dag). Scale bars: 2mm. (B) Relative transcript levels compared with WT as measured by quantitative RT-PCR analysis (mean transcript level ± confidence interval [CI]; one-way ANOVA). (C) Gravitropic index (mean GI index ± CI compared with WT; one-way ANOVA, n=18–39). Error bars represent the 95% confidence interval. Asterisks mark significant differences: *P<0.05; **P<0.005; ***P<0.001.

