Fig. 3.
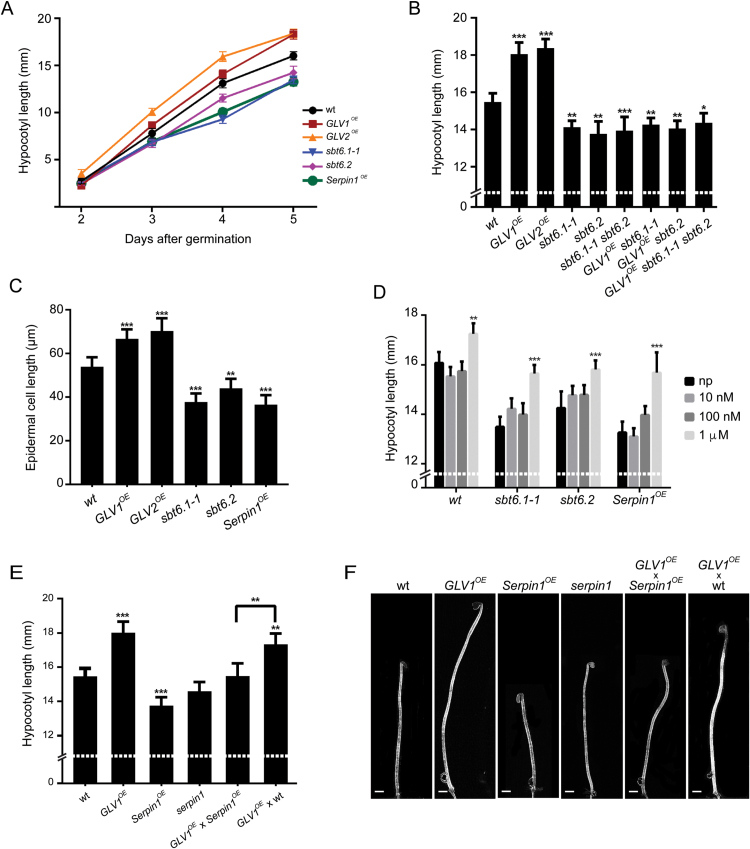
Hypocotyl elongation phenotypes. (A) Kinetics of etiolated hypocotyl growth (mean hypocotyl length in millimeters ± CI; two-way ANOVA; n=32–80). (B) Hypocotyl length 5 dag (mean hypocotyl length in millimeters ± CI compared with WT; one-way ANOVA; n=32–65). (C) Hypocotyl epidermal cell length (mean of the three most elongated cells from each seedling in micrometers, one-way ANOVA; n=15). (D) Increased hypocotyl length (in millimeters) upon GLV1p treatment. Peptide treatments at different concentrations were compared with mock-treated (without peptide; np) plants of the same genotype 5 dag (two-way ANOVA; n=52–100). Error bars represent the 95% confidence interval. Asterisks mark significant differences: *P<0.05, **P<0.005, ***P<0.001. (E) Hypocotyl length at 5 dag (mean hypocotyl length in millimeters ± CI compared with WT; one-way ANOVA; n=20–61). Hemizygous F1 plants were measured to assess the interaction between the GLV1 and AtSerpin1 gain-of-function in comparison with F1 plants resulting from a cross between GLV1 OE and WT plants. (F) Representative hypocotyl length. Error bars represent the 95% confidence interval. Asterisks mark significant differences: *P<0.05, **P<0.005, ***P<0.001. Scale bars: 1mm.

