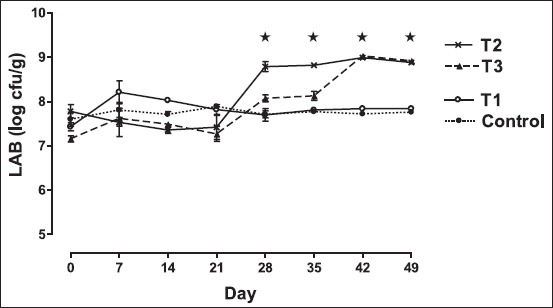
Figure-2.

Trend in mean±standard error of mean fecal lactic acid bacteria (LAB) count (colony-forming units/g fecal sample) in different groups of rat. Rats were fed with cholesterol-enriched diet from 0 up to 35th day cholesterol-enriched diet. The diets were supplemented with control - water (•); T1 - skim milk (○); T2 - non-fermented skim milk with B37 isolate (×); T3 - non-fermented skim milk with B9 isolate from 15th up to 35th day (▴). Fecal LAB count among different groups differ significantly (p<0.05). ⋆Indicates fecal lactobacilli count among different groups differ significantly (p<0.05).
