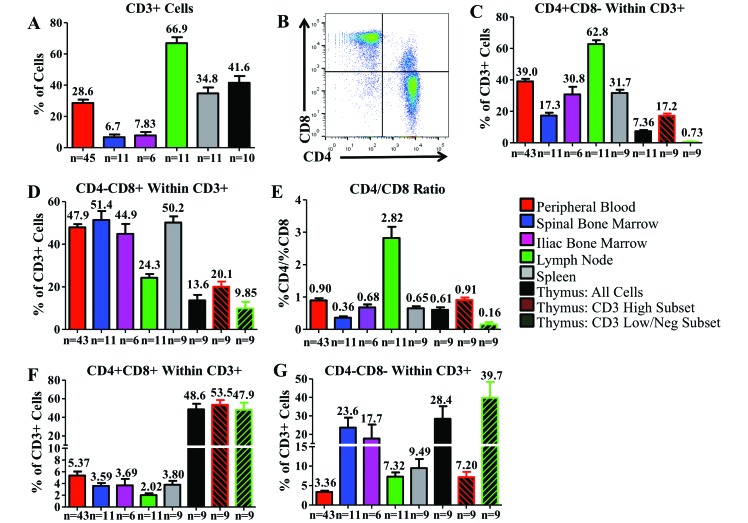
Figure 3.
Distributions of T-cell populations within the hematopoietic and lymphoid organs of cynomolgus macaques. (A) Comparison of the percentage of cells in each organ that are CD3+. (B) CD3+ cells from PB are subdivided into 4 populations (from top left, clockwise: CD4–CD8+, CD4+CD8+, CD4+CD8–, and CD4–CD8–). Between the studied organs, we compared the percentages of (C) CD4+CD8– and (D) CD4–CD8+. CD4+ and CD8+ single-positive cells can be directly compared by calculating (E) the CD4+CD8–: CD4–CD8+ T cell ratio. We examined the distribution of (F) CD4+CD8+and (G) CD4–CD8– cells in each organ. Data are given as mean ± SEM.

