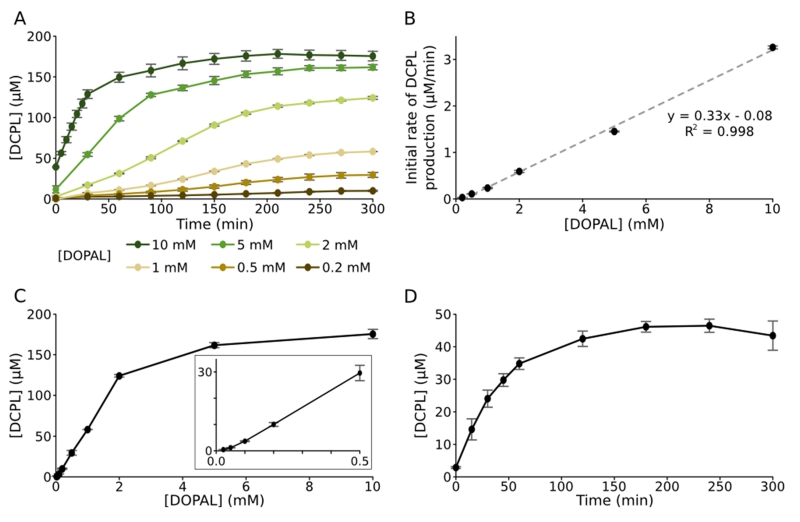
Figure 3.
Quantification of dicatechol pyrrole lysine. (A) DCPL formation over time was monitored by NMR for reactions with 1.5 mM Ac-Lys and varying concentrations of DOPAL. (B) Initial rates of DCPL formation for the reactions in (A) are plotted against DOPAL concentration and fit to a linear regression. (C) DCPL concentrations after 5 hour incubation of reactions with 1.5 mM Ac-Lys are plotted versus DOPAL concentration. The inset is a magnified view of the lower concentrations. (D) DCPL adduct formation in reactions between 2 mM DOPAL and 100 μM Ac-WT aS was quantified with Ehrlich’s reagent. In (A), (C), and (D), error bars denote standard deviations from three independent reactions and in (B) they denote standard errors for the linear fitting of initial rates.

