
FIGURE 1.
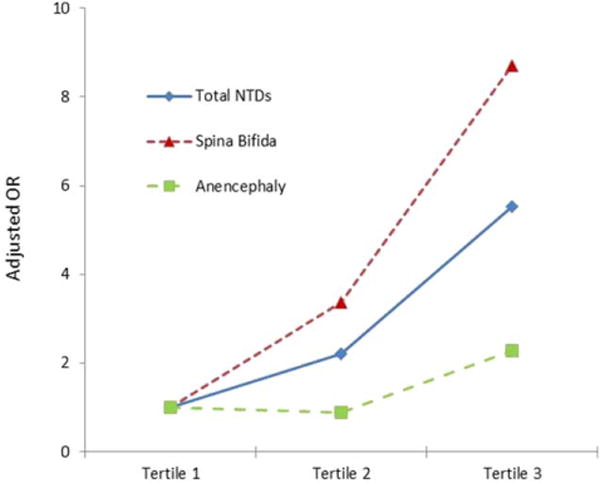
The triangles/squares/diamonds on the lines represent the point estimate of the adjusted odds ratios from the logistic model. A significant linear trend was observed in odds ratio of total NTDs across increasing tertile of IgG (P < 0.001), the same pattern was observed for both subtypes of spinal bifida and anencephaly. NTDs, neural tube defects; OR, odds ratio.