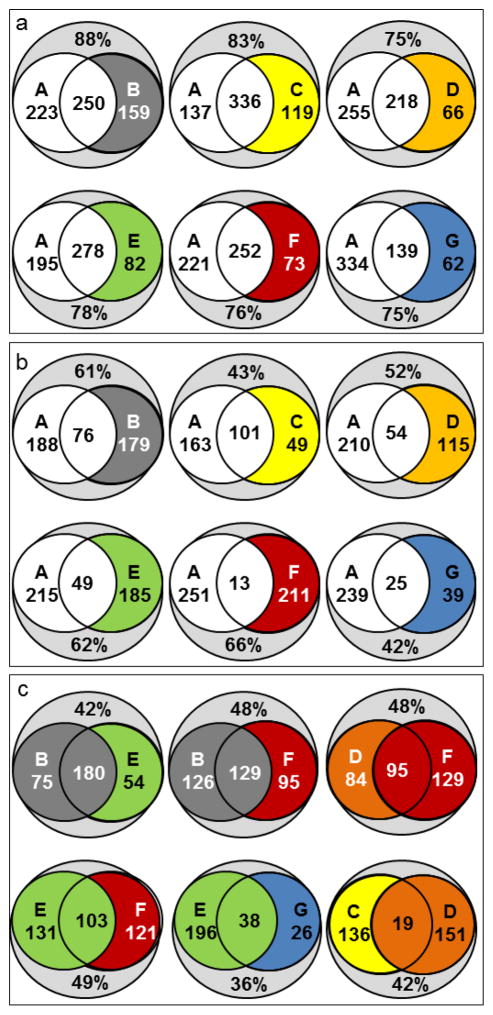
Fig. 3. Coverage comparison of RP-C18, mixed-mode and HILIC methods.
Numbers inside circles: Metabolites exclusively detected with each method. Center: compounds detected with both. Percentages relative to detectable compounds in library (714). a: Metabolites with good peakshapes. b: Well-retained compounds with good peakshapes and retention factors k ≥ 1. c: Overlapping selectivity ranges for zwitterionic HILIC methods (B vs. E), zwitterionic and neutral SPs (E and B vs. F), SPs with terminal amino groups (E vs. G), neutral HILIC (D vs. F) and for a mixed-mode column run in RP and HILIC modes (C vs. D).

