
FIG. 3.
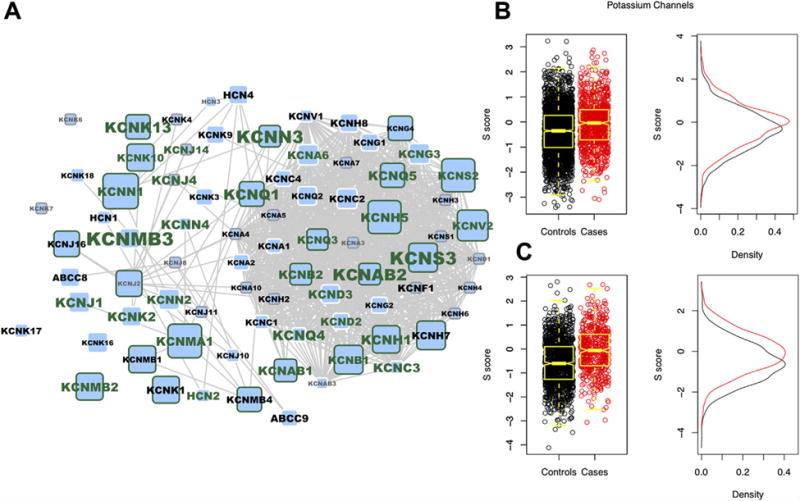
(A) The Potassium Channels pathway genes overlaid onto the STRING protein–protein interaction network (low confidence interactions, STRING score <0.5, were removed). Node size is proportion to the IMAGE2 gene P-value, while label size is proportional to the German ADHD GWAS gene P-value. Green node border indicates a gene P-value ≤0.05 in the IMAGE2 dataset, and a green label indicates the same in the German ADHD GWAS dataset. Gray border or label indicates no SNPs present in a particular gene. (B and C) Pathway of Distinction Analysis (PoDA) S scores showing a difference in the distribution between cases and controls in both the IMAGE2 and German ADHD GWAS datasets, respectively. [Color figure can be seen in the online version of this article, available at http://wileyonlinelibrary.com/journal/ajmgb]