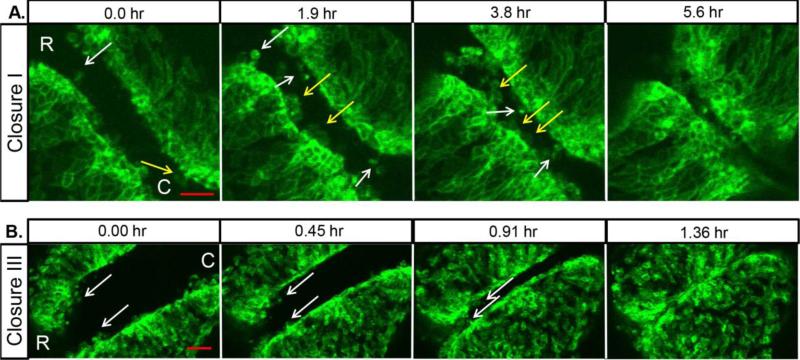
Fig. 1. NNE cells extend dynamic cellular projections at closure points.
(A) Imaging of the NNE in the hindbrain/cervical region of an initially 4 somite mouse embryo shows long narrow cellular projections (white arrows) and wide membrane ruffles (yellow arrows) that extend from NNE cells as the neural folds fuse at closure I. (B) Imaging of NNE at closure III starting at 13 somites shows a few cellular projections (white arrows) at the anterior-most end of the neural folds. Scale bars = 50μm. R=rostral, C=caudal

