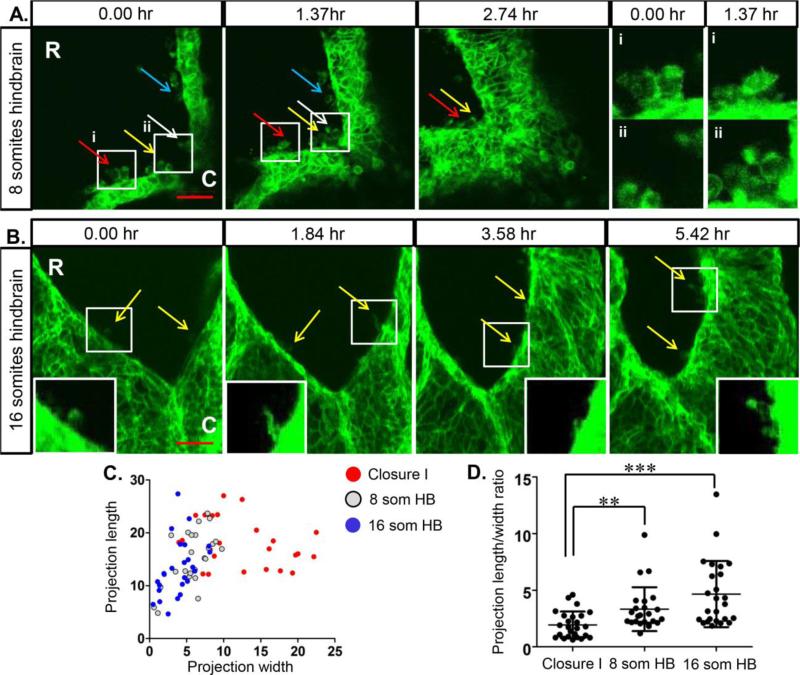
Fig. 2. NNE cells extend dynamic cellular projections during neural tube zipping.
(A) Imaging of the NNE in the hindbrain of an 8 somite embryo shows multiple round bulbous and ruffled cellular projections during zipping of the neural folds. Coloured arrows follow individual projections over time. White boxes indicate regions of higher magnification of projections in (i) and (ii) showing changes in individual projections over time. (B) Multiple filopodial-like projections are seen (yellow arrows) extending from the NNE along the neural folds of the closing anterior neuropore in a 16 somite embryo. White boxes indicate regions of higher magnification of projections in insets. Scale bars = 50μm. R=rostral, C=caudal. (C) Individual cellular projections observed in time-lapse imaging were measured and plotted as length versus width by region. While filopodial-like projections seen in the two regions of hindbrain zipping have overlapping dimensions, the ruffled projections seen in the region of Closure I are much wider, indicative of lamellipodia. (D) Measurements from individual projections were calculated to determine the length to width ratio. The projections present during Closure I have a significantly smaller ratio than those present in the zipping hindbrain regions. ** p < 0.005, ***p < 0.001

