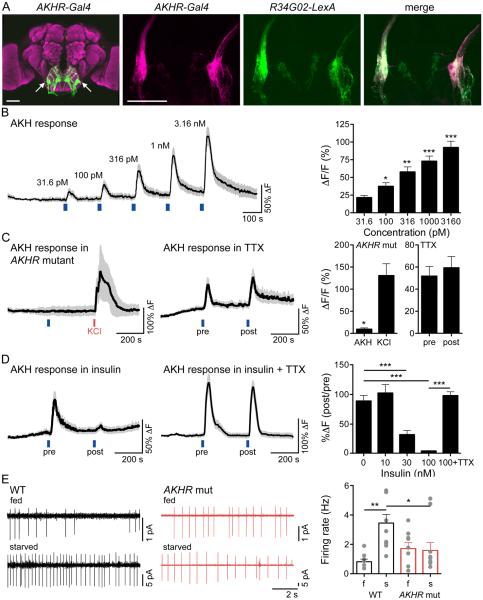
Figure 2. ISNs respond to AKH and are inhibited by insulin.
A. (left) Expression of AKHR-Gal4, UAS-mCD8::GFP in brain. (second) AKHR-Gal4, UAS-mCD8::RFP in SEZ, (third) R34G02-LexA, lexAop-mCD8::GFP in SEZ, (right) overlay. Scale 50 μm.
B. (left) GCaMP5G increase in ISNs in response to AKH (31.6 pM, 100 pM, 316 pM, 1 nM, 3.16 nM) applied at the blue lines. n=7, mean (black line) ± SEM (grey). (right) Maximum GCaMP5G increase (%ΔF/F) to AKH, mean ± SEM, same data as trace. Repeated-measures one way ANOVA followed by holm-sidak post hoc test, comparing to 31.6 pM response. *p<0.05, **p<0.01, ***p<0.001.
C. (left) GCaMP5G increase in ISNs to 1 nM AKH (blue line) or 30 mM KCl (red line) in the AKHR mutant. n=5, mean ± SEM. (middle) GCaMP5G increase in ISNs to 316 pM AKH (blue line) pre- or post-TTX (100 nM) application. n=8, mean ± SEM. (right) GCaMP5G increase (%ΔF/F) to AKH in the AKHR mutant (t-test, *p<0.05) or pre- or post-TTX application (t-test, ns). Mean ± SEM, same data as traces.
D. (left) GCaMP5G increase in ISNs to 316 pM AKH (blue line) pre- or post-insulin (100 nM) application. n=11, mean ± SEM. (middle) GCaMP5G increase in ISNs to 316 pM AKH (blue line) pre- or post-insulin (100 nM) and TTX (100 nM) application. n=10, mean ± SEM. (right) GCaMP5G change (%ΔF). Mean ± SEM, insulin concentrations in the absence of TTX: One-way ANOVA with Dunnet’s post hoc test comparing to 0 nM Insulin, ***p<0.001. Effect of TTX: t-test (100nM Insulin vs. 100nM insulin + TTX), ***p<0.001, same data as traces plus additional insulin concentrations.
E. (left) Example cell-attached recordings from AKHR+ SEZ neurons in AKHR mutant or wild type flies, fed (f) or starved (s) 24H, and (right) summary graph. n = 6-11, mean +/− SEM, one-way ANOVA, Tukey Post Hoc, **p<0.01, *p<0.05. See Figure S2, showing that ISNs are not taste-responsive.

