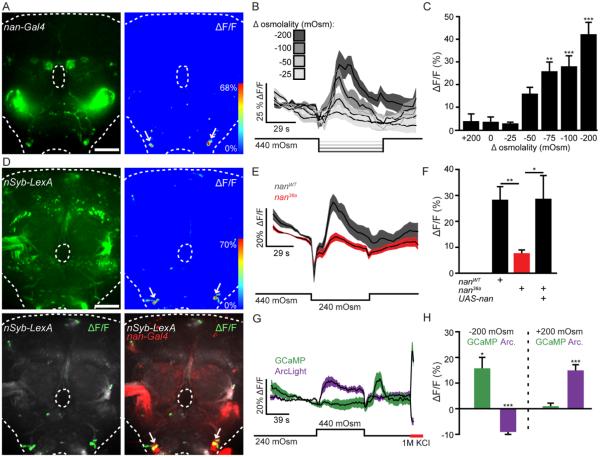
Figure 4. Nanchung SEZ neurons respond to osmolality.
A. nan-Gal4, UAS-GCaMP6s expression in brain (left) and example ΔF/F heat-map of the same brain (right) upon an extracellular osmolality decrease of 200mOsm/kg. Scale 50 μm.
B. ΔF/F traces (mean ± SEM) for osmolality decreases of 25, 50, 100, and 200 mOsm/Kg (n=9-12 brains/condition).
C. Maximum ΔF/F responses (mean ± SEM) for osmolality changes. n=7-12 brains/condition, One way ANOVA, Dunnet’s Post Hoc to mock (0 mOsm change) **p<0.01, ***p<0.001, data from B plus additional osmolalities.
D. (top left) nSyb-LexA, lexAop-GCaMP6s expression in brain. (top right) ΔF/F heat-map to an osmolality decrease of 200mOsm/kg in the same brain. (bottom left) ΔF/F response (green) overlayed on nSyb-LexA, lexAop-GCaMP6s expression (grey). (bottom right) ΔF/F response (green) overlayed on nSyb-LexA, lexAop-GCaMP6s (grey) and nan-Gal4 expression (red) in same brain. Scale 50 μm.
E. ΔF/F traces upon osmolality decreases of 200 mOsm/Kg in nan36a mutant or wild type (WT) flies. n=28-33. E-H: data are mean ± SEM.
F. ΔF/F graphs for WT, mutant, and rescue flies (UAS-nan; nan36a). n=33, 28, and 12. one-way ANOVA,Tukey Post Hoc, *p<0.05, **p<0.01, data from E plus rescue.
G. ΔF/F traces to 200 mOsm/Kg osmolality decreases in flies expressing UAS-GCaMP6s (green, n=9 brains) or UAS-ArcLight (magenta, n=11 brains) in ISNs.
H. ΔF/F graphs for GCaMP6s and ArcLight from F. One sample t-tests for difference from theoretical mean of 0.0, *p<0.05, ***p<0.001.
See also Figure S3, showing quantification of whole brain responses.

