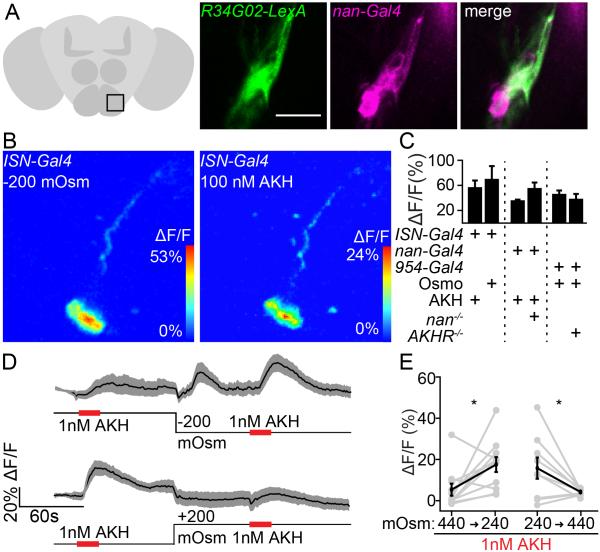
Figure 5. Nanchung SEZ neurons are ISNs.
A. Co-expression of R34G02-LexA and nan-Gal4 in ISNs. Zoom shows one nan-Gal4 cluster. Scale 20 μm.
B. (left) Low osmolality response and (right) AKH response in the same cell.
C. maximum ΔF/F graphs (mean ± SEM) to 200 mOsm/kg osmolality decreases (Osmo) or 1 nM AKH in control or mutant backgrounds. n=5-10 brains, t-test Holm-Sidak correction, ns.
D. ΔF/F traces (mean ± SEM) to 1 nM AKH in 440 mOsm/kg (high) or 240 mOsm/Kg (low) extracellular osmolality and graph of ΔF/F responses. Top: n=9 brains. Bottom: n = 11 brains.
E. Quatification of ΔF/F graphs from D , mean ± SEM. brains, paired t-test, *p<0.05.
See also Figure S4, showing that the AKHR-, Nan+ neurons do not respond to osmolality.

