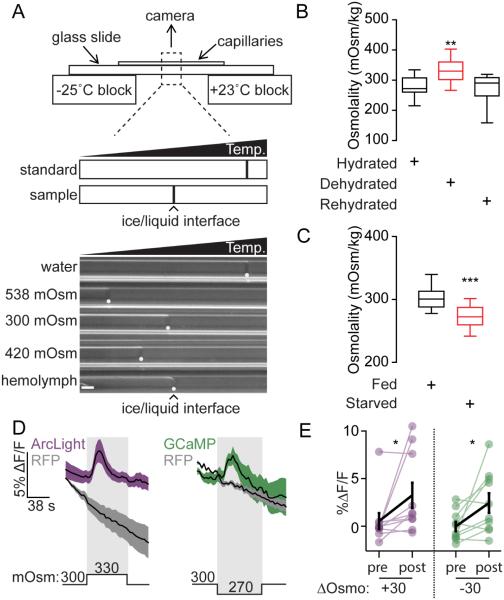
Figure 6. Drosophila hemolymph osmolality decreases during starvation.
A. Top: Temperature (Temp.) gradient osmometer. Distance between sample and standard ice/liquid interfaces was used to calculate sample osmolality. Bottom: Freezing interfaces (white dots) from standards and single fly hemolymph. Scale 0.05 mm.
B. Desiccation affects hemolymph osmolality. n=14-17, one way ANOVA, Tukey’s Post Hoc, **p<0.01. Dehydrated: 6 hours at <20% RH. Hydrated: 6 hours in a humid box. Rehydrated: water was administered as described in methods.
C. Starvation affects hemolymph osmolality. n=14, t-test, ***p<0.001.
D. ΔF/F traces (mean ± SEM) to 30 mOsm/Kg osmolality decreases or increases in flies expressing UAS-GCaMP6s (green, n=10 brains) or UAS-ArcLight (magenta, n=10 brains) in ISNs.
E. ΔF/F graphs (mean ± SEM) for GCaMP6s and ArcLight from D. Wilcoxon matched-pairs signed rank test, *p<0.05.

