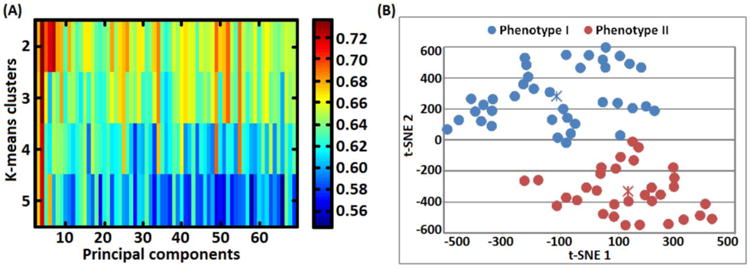
Figure 3.

A) Grid-search plot illustrating a search for optimal number of principal components and k-means number of clusters that lead to a high silhouette width value. The grid-search process selected 4 components accounting for 43.09 % variance and 2 clusters with a silhouette width value of 0.735. B) 2-dimensional (2D) visualization of phenotype I and phenotype II patient groups. Low dimensional 2D points were generated using the t-distributed stochastic neighbor embedding (t-SNE) technique by mapping the most relevant principal components (leading to a high silhouette width value) from a high-dimensional (4D) into a lower visually plausible 2D space. Importantly, the two phenotypes did not overlap with DSM-IV related categories (BP I, II and BP-NOS). Notably, t-SNE units are arbitrary and they only depict subjects' similarities based on euclidean distances.
