
Figure 5.
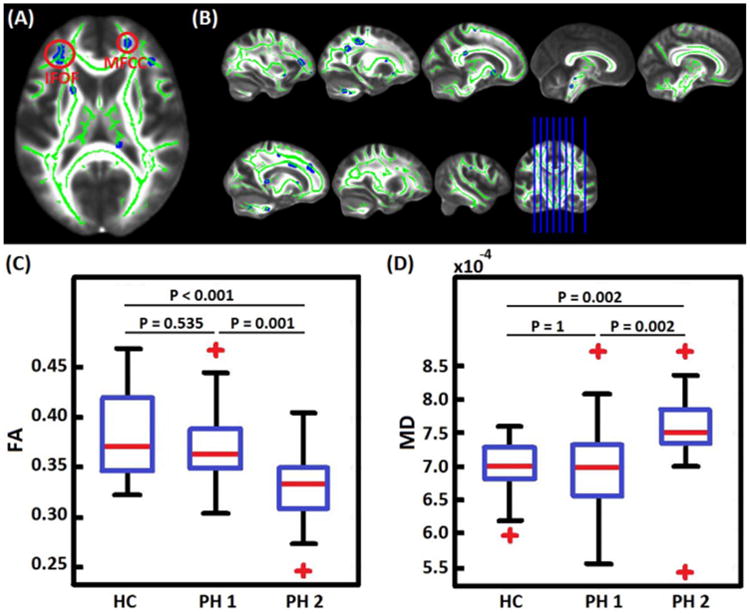
A) The most relevant white-matter tracts in distinguishing phenotype I from phenotype II patients at an individual subject level. IFOF – inferior fronto-occipital fasciculus, MFCC - minor forceps of the corpus callosum. B) A multisclice view of the most relevant clusters. C) A comparison of FA values within IFOF cluster in healthy controls (HC), phenotype I (PH1) and phenotype II (PH2). Phenotype II patients showed reduced FA values as compared to healthy controls and phenotype I patients. D) A comparison of MD values within IFOF cluster in healthy controls (HC), phenotype I (PH1) and phenotype II (PH2). Phenotype II patients showed increased MD values as compared to healthy controls and phenotype I patients. These analysis of Variance (ANOVA) statistical tests were performed using SPSS Version 20, IBM Inc and corrected for multiple comparisons using the Bonferroni method.