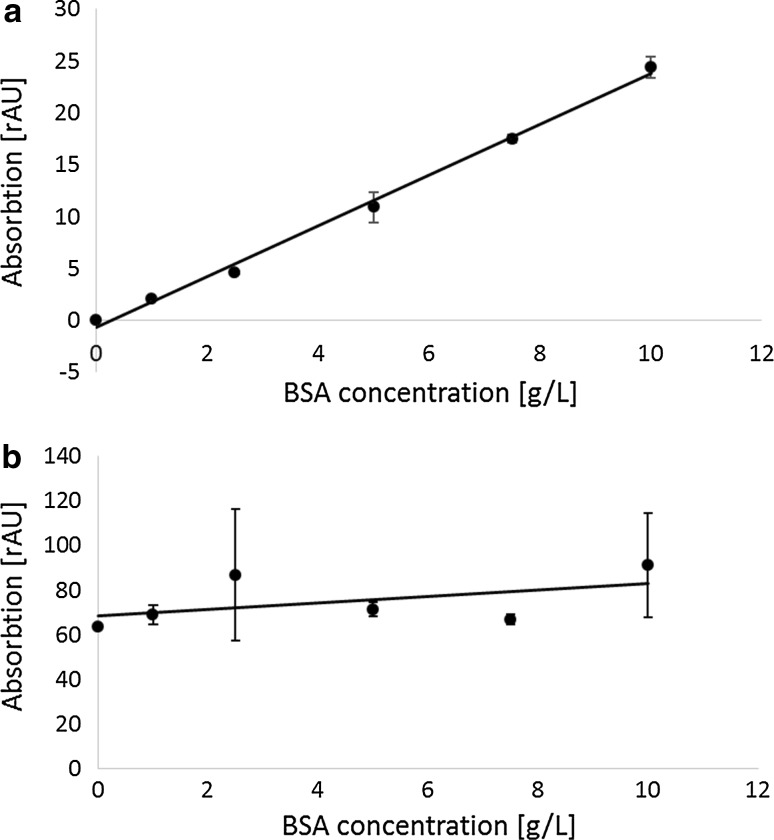
Fig. 1.
Protein quantification by BCA assay is highly sensitive to sample matrix composition; protein quantification of BSA dilution rows in reference buffer versus spent synthetic culture medium as sample matrix. The standard deviations for each sample (n = 5) are indicated as whiskers; a dilution row of BSA measured in the background NaOH/SDS yielding a R 2 of 0.995 and a mean relative standard deviation of 5.43 %. b Dilution row of BSA standards measured in synthetic culture medium yielding a R 2 of 0.255 and a mean relative standard deviation of 12.6 %. In fermentation medium the 10 g/L spike signal is not significantly larger than the 1 g/L spike level (Welch test: p(t) = 0.0796)

