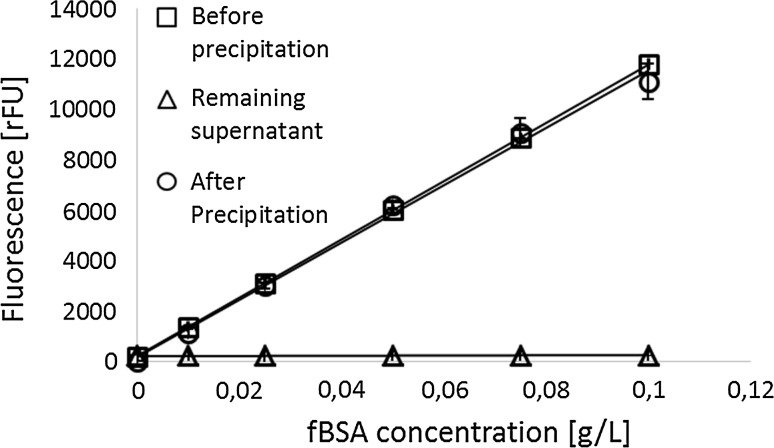
Fig. 2.
Protein precipitation by TCA is quantitative; fluorescence measurements of BSA dilution rows of TCA-precipitated, synthetic process media supplemented with fBSA are displayed. All samples were measured in quadruplicates (n = 4); the standard deviations are indicated as whiskers. 99.7–97.5 % of the added fBSA was recovered in the reference buffer (after precipitation), and only 0.3–2.5 % of the initial fluorescence was found in the supernatant (remaining supernatant). The fluorescence intensity before precipitation (before precipitation) and after precipitation (after precipitation) correlated with the nominal concentration of the stock solution (R 2 > 0.99). The fluorescence intensity found in the supernatant is almost negligible and not correlated with the spike concentration (R 2 = 0.24)

