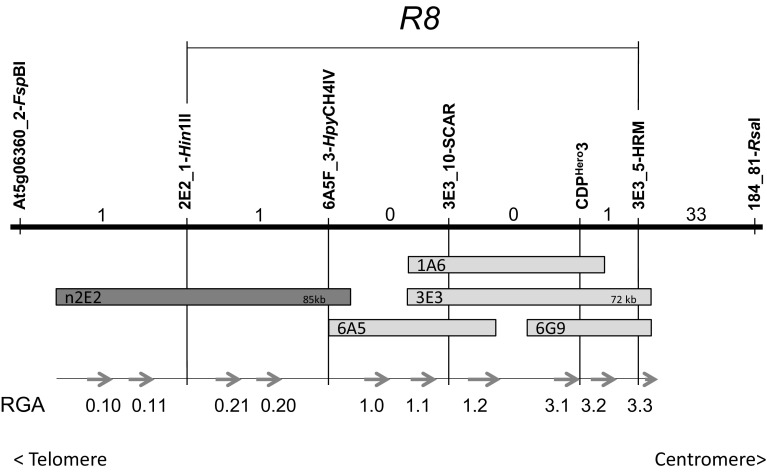
Fig. 1.
Genetic and physical map of R8 on the bottom end of chromosome 9. The upper part of this figure represents a genetic map. Markers of different origin were mapped in an F1 recombinant population of 1670 individuals and their relative positions are indicated by vertical lines. The number of recombinants between the markers is indicated by numbers between the vertical lines. The horizontal line marked by R8 indicates the genetic mapping interval for R8. The lower part of this figure represents a physical map. Using molecular markers, BAC clones were identified from BAC libraries derived from MaR8. The grey bars represent the individual BAC clones. Vertical lines indicate the connection between the physical and genetic maps. Arrows indicate the position and orientations of resistance gene analogues (RGA0.10-RGA3.3) on the physical map. RGA0.20 is the functional R8 gene

