Fig 1.
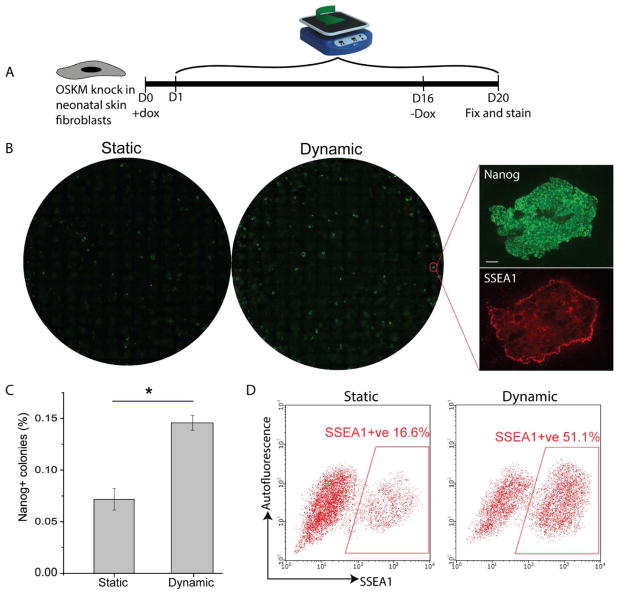
The effect of dynamic culture on cell reprogramming efficiency. A. Schematics of experiment. OSKM expression was induced from day 1 to day 16, and withdrawn from day 16 onwards. Dynamic culture was applied from day 1 onwards. B. Whole well image of Nanog+ colonies for static and dynamic culture. Insets are exemplified high magnification views. Scale bar denotes 100 μm. C. Quantification of reprogramming efficiencies for static and dynamic culture. The number of Nanog+ colonies was normalized by initial seeding density to calculate the efficiency. (*p<0.05. n=6.) D. Quantification of the percentage of SSEA1+ cells by flow cytometry to measure the reprogramming efficiency at individual cell level.

