Figure 2.
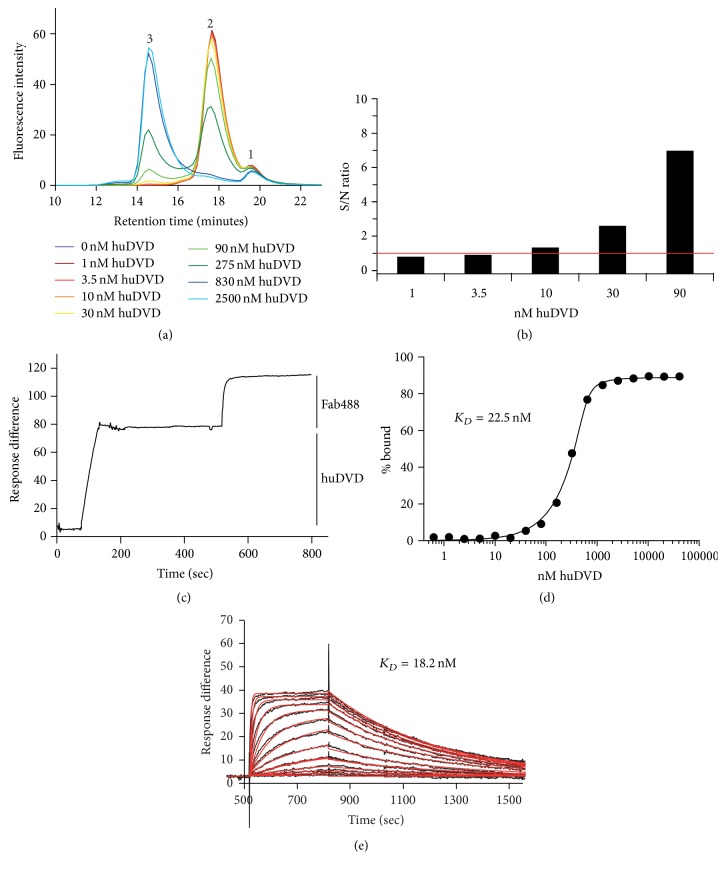
(a) Titration of huDVD on Fab488. 678 nM Fab488 and 1–2500 nM huDVD were incubated in 20% cynoserum as described in Section 2 and separated by size exclusion chromatography with fluorescence detection. Peak 1 is the free dye (DyLight 488), peak 2 is Fab488, and peak 3 is the complex of Fab488 and huDVD. (b) Determination of sensitivity. The signal to noise ratio (S/N ratio) of peak 3 was determined by dividing the percentage of the peak area of peak 3 in runs containing huDVD by the corresponding percentage of peak area at the same retention time of a control run containing no huDVD. (c) Stoichiometry. SPR signal showing the binding of huDVD to anti-human IgG Fc coated CM5 chip (0–200 sec) and the binding of Fab488 at saturation (500–800 sec). The average binding of huDVD was 78 response units and that of Fab488 37 response units (200000 and 47150 Da). (d) K D of the binding of Fab488 to huDVD in 20% cynoserum determined by SEC. The % bound was calculated from the area of peak 3 as compared to total fluorescence as shown in experiment (a), plotted versus the concentration of huDVD, and fitted to the specific binding equation as described in Section 2 to determine the equilibrium dissociation constant (K D). (e) K D of the binding of Fab488 to huDVD determined by SPR. Association (500–800 sec) and dissociation (800–1500 sec) of Fab488 (0.49–2000 nM) to and from huDVD bound to an anti-human IgG coated chip. The data points (black curve) were fitted to a 1 : 1 Langmuir binding model (red curve).

