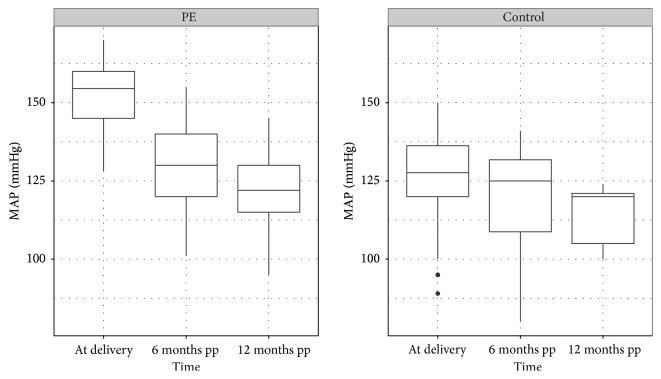
Figure 3.
Distribution of mean arterial pressure values (MAP) in controls and PE patients. PE patients at delivery 109 mmHg (±9.6 SD), 6 months postpartum (pp) 100 mmHg (±10.6 SD), and 12 months postpartum (pp) 91 mmHg (±13.6 SD). Controls: at delivery 92 mmHg (±12.6 SD), 6 months postpartum (pp) 93 mmHg (±13.0 SD), and 12 postpartum (pp) 95 mmHg (±7.6 SD).

