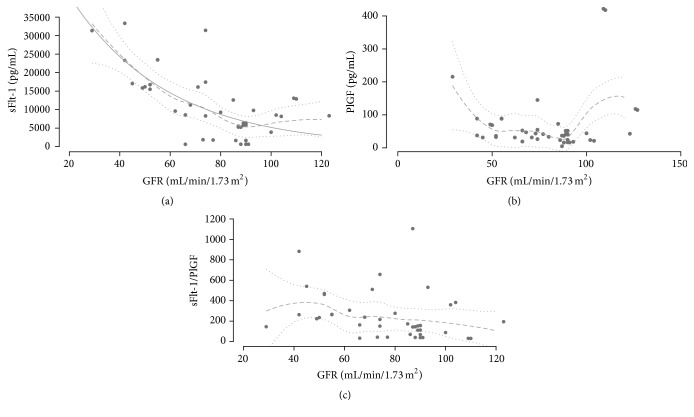
Figure 4.
(a) Distribution of sFlt-1 in relation to GFR in PE patients. Predicted values from loess regression are shown together with 95% confidence intervals (discontinuous lines). Predicted values from NLS regression (y = aexp(−x/b)) are shown in solid line. Estimated parameter values were a = 68169.27 b = 38.84402. (b) Distribution of PlGF in relation to GFR in PE patients. Predicted values from loess regression are shown together with 95% confidence intervals (discontinuous lines). (c) Distribution of sFlt-1/PlGF-ratio in relation to GFR in PE patients. Predicted values from loess regression are shown together with 95% confidence intervals (discontinuous lines).

