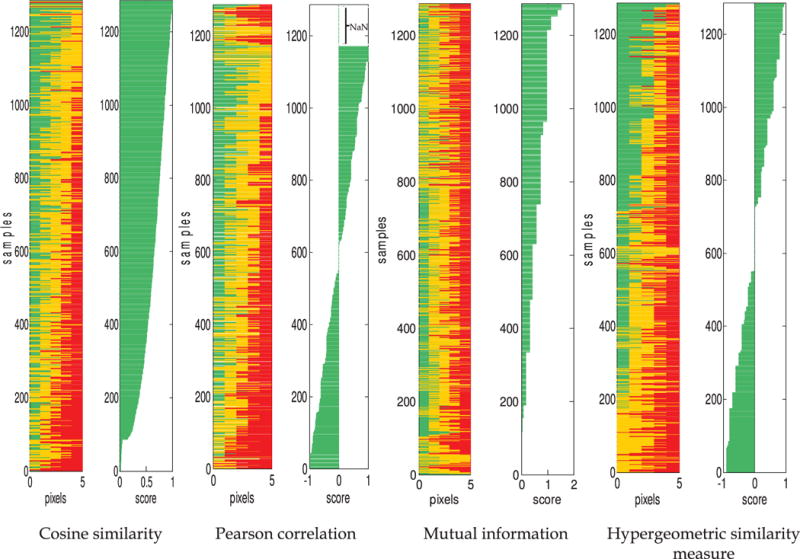
Fig. 5.

Comparison of sample rankings by the four similarity measures for the synthetic data set containing all tables for N=5. Each sample (horizontal bar) contains a certain number of exact matches, slight mismatches, and large mismatches (corresponding to [green, yellow, and red], or [medium, light, and dark] in grayscale). The length of each color segment corresponds to the number of that type of match in the sample. For each similarity measure, the similarity score for each sample is shown on the right.
