
Figure 6.
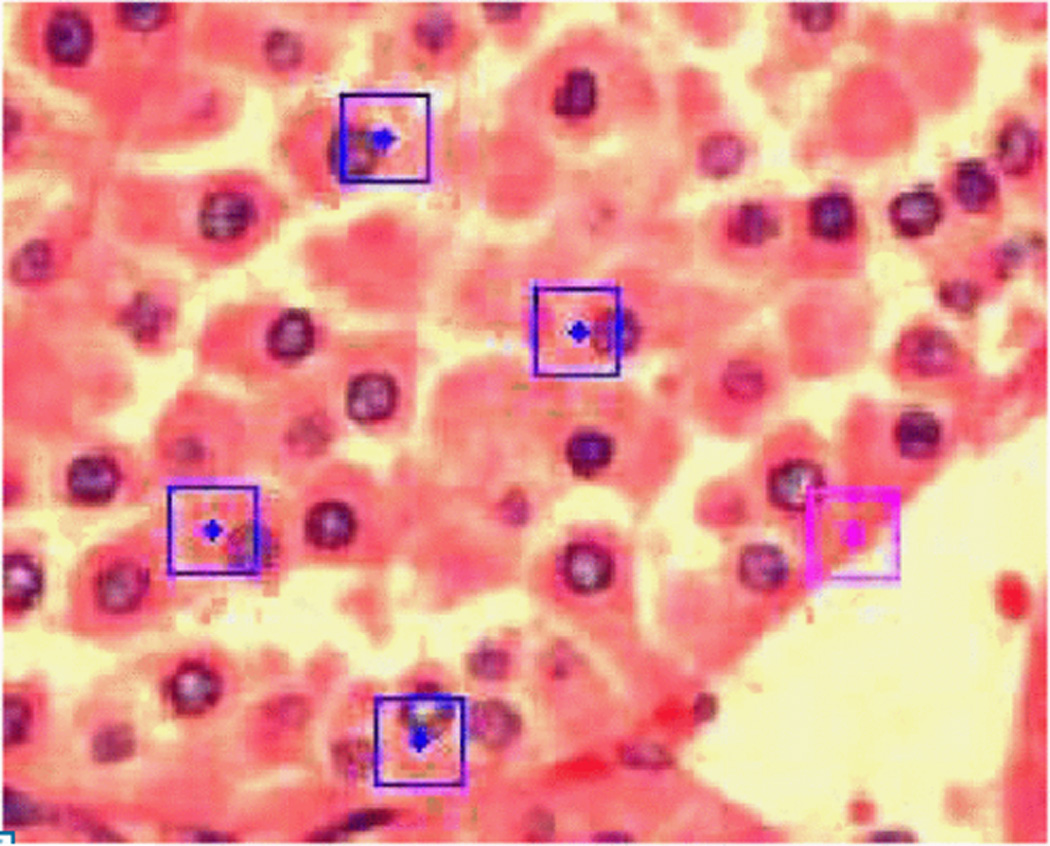
Oncocytoma RCC image showing key points matched with most common occurring cluster in vocabulary. Square represents the region used for SIFT feature computation and dot represents the center.
Official websites use .gov
A
.gov website belongs to an official
government organization in the United States.
Secure .gov websites use HTTPS
A lock (
) or https:// means you've safely
connected to the .gov website. Share sensitive
information only on official, secure websites.
Oncocytoma RCC image showing key points matched with most common occurring cluster in vocabulary. Square represents the region used for SIFT feature computation and dot represents the center.