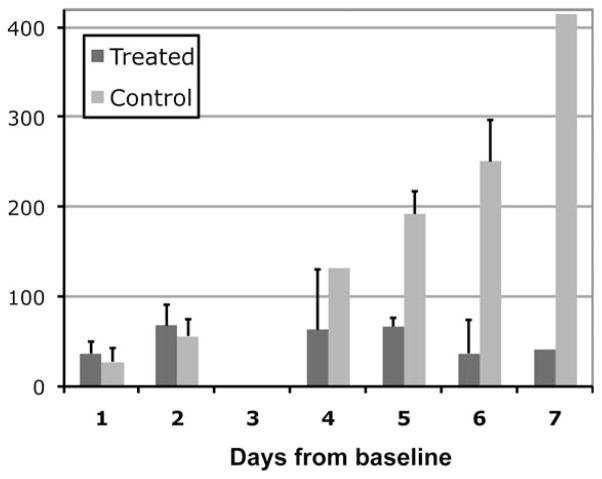
Figure 2.
Percent tumor volume change from baseline for the treated and control groups between 1 to 7 days following treatment. Both groups showed an increase in their tumor volume at days 1 and 2 (P > 0.2). The statistical test was confined to days 1 and 2 due to the lack of data at other timepoints.

