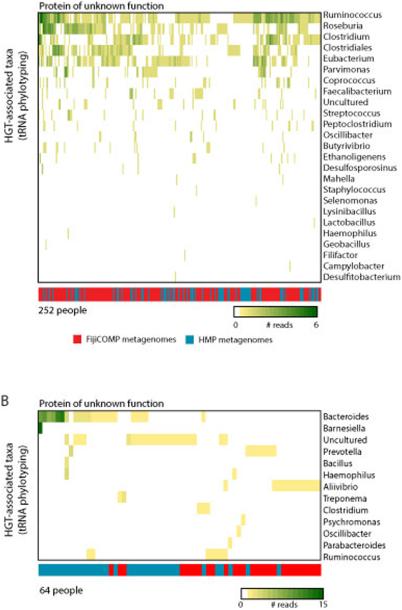
Extended Data Figure 6. Mobile genes are observed in a wide variety of bacterial host backgrounds across the two cohorts.
(A,B) A heatmap is plotted showing the number of read-pairs per person that aligned to both a tRNA gene and two specific horizontally transferred genes. Colors within the heatmap reflect the read abundance according to the species associated with the specific tRNA gene. The color bar represents from which meteganomic cohort the reads are from: FijiCOMP (red) and HMP (blue).

