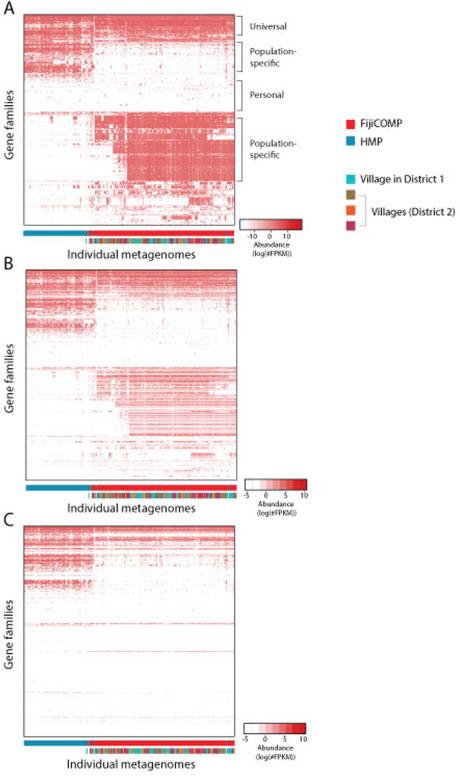
Extended Data Figure 3. The abundance of mobile gene families are largely determine by cohort.
(A) A heatmap is plotted showing the abundances (FPKM) of mobile genes aggregated by functional gene family (COG assignment, KEGG, TIGRFAM or PFAM family) within each of the metagenomic samples. Hierarchical clustering using complete linkage was performed on the Euclidean distances between profiles of functional gene families across individuals; and on the distances between individuals’ mobile gene composition. Values are plotted on a logarithmic scale. (B) A heatmap is plotted showing the abundances (FPKM) of only those mobile gene families that were deemed of higher confidence within each of the metagenomic samples. These include mobile gene families from mobile genes that were annotated as horizontal transfer machinery or had additional support for their phylogenetic placement. The placements of gene families and individuals were maintained from Extended Data Figure 3A for comparative purposes. (C) A heatmap is plotted showing the abundances (FPKM) of only those mobile genes that were observed to be transferred between HMP reference genomes within each of the metagenomic samples. The placements of gene families and individuals were maintained from Extended Data Figure 3A for comparative purposes.

