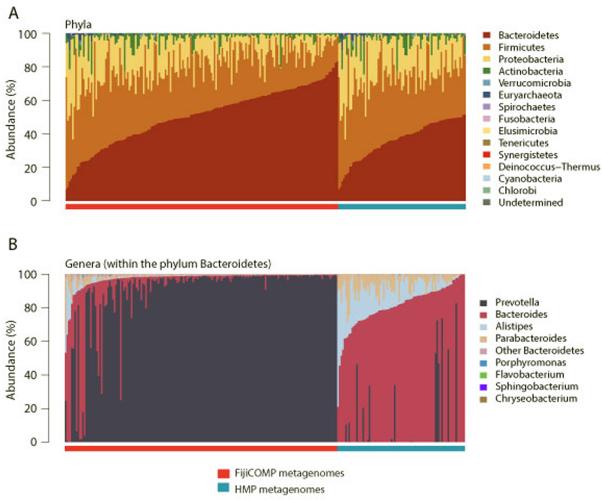
Extended Data Figure 5. Composition of the gut microbiomes of HMP and FijiCOMP study participants.
(A) Relative abundances of bacteria according to phylum are plotted for metagenomic samples from individuals in the HMP (blue) and FijiCOMP (red) cohorts. Samples are sorted according to cohort and the abundance of the dominant phyla. (B) Relative abundances of families within the Order Bacteriodales are plotted for metagenomic samples from individuals in the HMP (blue) and FijiCOMP (red) cohorts. Samples are sorted according to cohort and the abundance of the top Bacteroidales member.

